41 Working with KML data
Contents
41 Working with KML data#
KML is a file format used to display geographic data in an Earth browser such as Google Earth. KML uses a tag-based structure with nested elements and attributes and is based on the XML standard.

Source: https://developers.google.com/kml/documentation/kml_tut
Set File Paths and download Tutorial Data#
If you downloaded the latest GemGIS version from the Github repository, append the path so that the package can be imported successfully. Otherwise, it is recommended to install GemGIS via pip install gemgis and import GemGIS using import gemgis as gg. In addition, the file path to the folder where the data is being stored is set. The tutorial data is downloaded using Pooch (https://www.fatiando.org/pooch/latest/index.html) and stored in the specified folder. Use
pip install pooch if Pooch is not installed on your system yet.
[1]:
import gemgis as gg

file_path ='data/41_working_with_kml_data/'
WARNING (theano.configdefaults): g++ not available, if using conda: `conda install m2w64-toolchain`
C:\Users\ale93371\Anaconda3\envs\test_gempy\lib\site-packages\theano\configdefaults.py:560: UserWarning: DeprecationWarning: there is no c++ compiler.This is deprecated and with Theano 0.11 a c++ compiler will be mandatory
  warnings.warn("DeprecationWarning: there is no c++ compiler."
WARNING (theano.configdefaults): g++ not detected ! Theano will be unable to execute optimized C-implementations (for both CPU and GPU) and will default to Python implementations. Performance will be severely degraded. To remove this warning, set Theano flags cxx to an empty string.
WARNING (theano.tensor.blas): Using NumPy C-API based implementation for BLAS functions.
[2]:
gg.download_gemgis_data.download_tutorial_data(filename="41_working_with_kml_data.zip", dirpath=file_path)
Downloading file '41_working_with_kml_data.zip' from 'https://rwth-aachen.sciebo.de/s/AfXRsZywYDbUF34/download?path=%2F41_working_with_kml_data.zip' to 'C:\Users\ale93371\Documents\gemgis\docs\getting_started\tutorial\data\41_working_with_kml_data'.
Loading the data#
The data used for demonstration purposes here was downloaded from https://developers.google.com/kml/documentation/KML_Samples.kml. The different layers the KML consists of can be listed using fionas listlayers(...) function. When using GeoPandas, the KML driver has to be activated using gpd.io.file.fiona.drvsupport.supported_drivers['KML'] = 'rw'. When loading a layer with GeoPandas, the driver needs to be provided as well as the layer name. If no layer is provided, only the first
element will be loaded.
[8]:
import geopandas as gpd
import fiona

gpd.io.file.fiona.drvsupport.supported_drivers['KML'] = 'rw'

layer_list = fiona.listlayers(file_path + 'KML_Samples.kml')
layer_list
[8]:
['Placemarks',
 'Highlighted Icon',
 'Paths',
 'Google Campus',
 'Extruded Polygon',
 'Absolute and Relative']
Loading Placemarks#
[16]:
gdf_placemarks = gpd.read_file(filename=file_path+'KML_Samples.kml', driver='KML' , layer='Placemarks')
gdf_placemarks
[16]:
| Name | Description | geometry | |
|---|---|---|---|
| 0 | Simple placemark | Attached to the ground. Intelligently places i... | POINT Z (-122.08220 37.42229 0.00000) |
| 1 | Floating placemark | Floats a defined distance above the ground. | POINT Z (-122.08407 37.42200 50.00000) |
| 2 | Extruded placemark | Tethered to the ground by a customizable "tail" | POINT Z (-122.08577 37.42157 50.00000) |
Loading Icon#
[10]:
gdf_highlight = gpd.read_file(filename=file_path+'KML_Samples.kml', driver='KML' , layer='Highlighted Icon')
gdf_highlight
[10]:
| Name | Description | geometry | |
|---|---|---|---|
| 0 | Roll over this icon | POINT Z (-122.08565 37.42243 0.00000) |
Loading Paths#
[11]:
gdf_paths = gpd.read_file(filename=file_path+'KML_Samples.kml', driver='KML' , layer='Paths')
gdf_paths
[11]:
| Name | Description | geometry | |
|---|---|---|---|
| 0 | Tessellated | If the <tessellate> tag has a value of 1, the ... | LINESTRING Z (-112.08142 36.10678 0.00000, -11... |
| 1 | Untessellated | If the <tessellate> tag has a value of 0, the ... | LINESTRING Z (-112.08062 36.10673 0.00000, -11... |
| 2 | Absolute | Transparent purple line | LINESTRING Z (-112.26565 36.09448 2357.00000, ... |
| 3 | Absolute Extruded | Transparent green wall with yellow outlines | LINESTRING Z (-112.25508 36.07955 2357.00000, ... |
| 4 | Relative | Black line (10 pixels wide), height tracks ter... | LINESTRING Z (-112.25328 36.09887 645.00000, -... |
| 5 | Relative Extruded | Opaque blue walls with red outline, height tra... | LINESTRING Z (-112.26566 36.09445 630.00000, -... |
Loading Google Campus#
[12]:
gdf_campus = gpd.read_file(filename=file_path+'KML_Samples.kml', driver='KML' , layer='Google Campus')
gdf_campus
[12]:
| Name | Description | geometry | |
|---|---|---|---|
| 0 | Building 40 | POLYGON Z ((-122.08489 37.42257 17.00000, -122... | |
| 1 | Building 41 | POLYGON Z ((-122.08574 37.42227 17.00000, -122... | |
| 2 | Building 42 | POLYGON Z ((-122.08579 37.42136 25.00000, -122... | |
| 3 | Building 43 | POLYGON Z ((-122.08444 37.42177 19.00000, -122... |
Loading Polygon#
[13]:
gdf_polygon = gpd.read_file(filename=file_path+'KML_Samples.kml', driver='KML' , layer='Extruded Polygon')
gdf_polygon
[13]:
| Name | Description | geometry | |
|---|---|---|---|
| 0 | The Pentagon | POLYGON Z ((-77.05788 38.87253 100.00000, -77.... |
Loading Absolute and Relative#
[14]:
gdf_absolute = gpd.read_file(filename=file_path+'KML_Samples.kml', driver='KML' , layer='Absolute and Relative')
gdf_absolute
[14]:
| Name | Description | geometry | |
|---|---|---|---|
| 0 | Absolute | POLYGON Z ((-112.33725 36.14889 1784.00000, -1... | |
| 1 | Absolute Extruded | POLYGON Z ((-112.33966 36.14638 1784.00000, -1... | |
| 2 | Relative | POLYGON Z ((-112.33495 36.14989 100.00000, -11... | |
| 3 | Relative Extruded | POLYGON Z ((-112.33488 36.15140 100.00000, -11... |
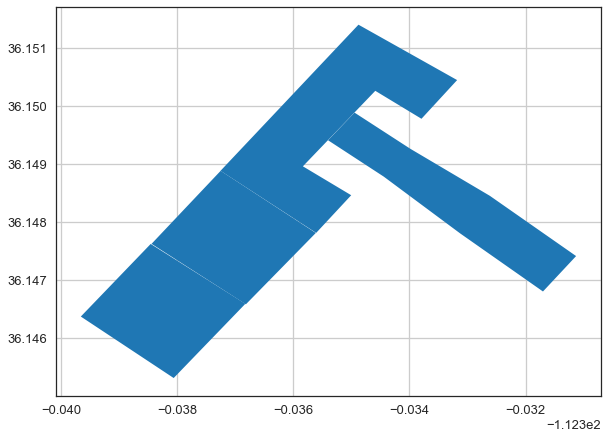
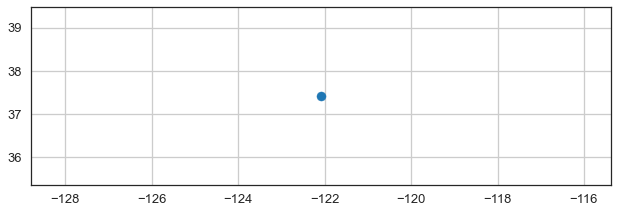
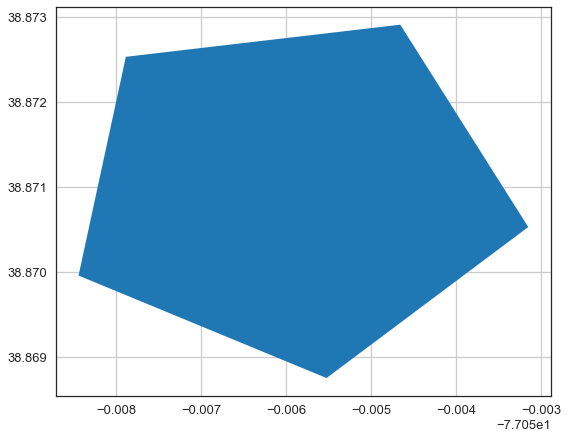
Plotting the Data#
The data was just simply plotted to visualize the content of the KML file.
[35]:
import matplotlib.pyplot as plt

gdf_placemarks.plot(aspect='equal')
plt.grid()

[34]:
gdf_highlight.plot(aspect='equal')
plt.grid()
[33]:
gdf_paths.plot(aspect='equal')
plt.grid()

[32]:
gdf_campus.plot(aspect='equal')
plt.grid()

[30]:
gdf_polygon.plot(aspect='equal')
plt.grid()
[27]:
gdf_absolute.plot(aspect='equal')
plt.grid()