
04 Clipping Vector and Raster Data
Contents
04 Clipping Vector and Raster Data#
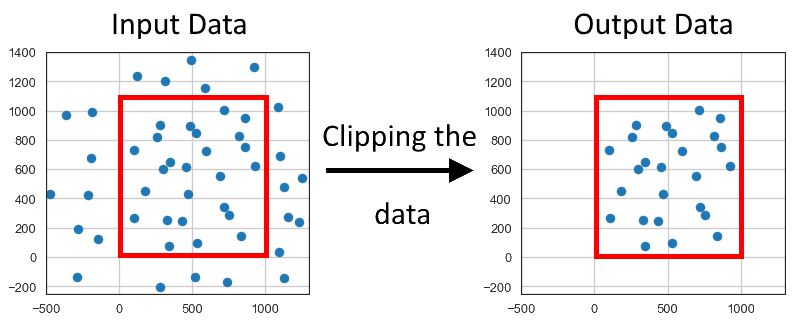
Loaded datasets may be cropped or clipped if the spatial extent of data is far beyond what is needed for the tasks at hand. The clipping can be done by either providing a rectengular extent or by providing a Shapely polygon. The clipping can be applied to Point, MultiPoint, LineString, MultiLineString, Polygon and MultiPolygon data.
The vector data is loaded with GeoPandas and the raster data is loaded with rasterio and then clipped with the built-in GemGIS functions.
Set File Paths and download Tutorial Data#
If you downloaded the latest GemGIS version from the Github repository, append the path so that the package can be imported successfully. Otherwise, it is recommended to install GemGIS via pip install gemgis and import GemGIS using import gemgis as gg. In addition, the file path to the folder where the data is being stored is set. The tutorial data is downloaded using Pooch (https://www.fatiando.org/pooch/latest/index.html) and stored in the specified folder. Use
pip install pooch if Pooch is not installed on your system yet.
[1]:
import gemgis as gg

file_path ='data/04_clipping_data/'
[2]:
gg.download_gemgis_data.download_tutorial_data(filename="04_clipping_data.zip", dirpath=file_path)
Clipping Vector Data by extent#
[3]:
import geopandas as gpd
import matplotlib.pyplot as plt

gdf = gpd.read_file(file_path + 'randompoints.shp')

gdf.head()
[3]:
| id | geometry | |
|---|---|---|
| 0 | None | POINT (281.52576 902.08681) |
| 1 | None | POINT (925.86670 618.57679) |
| 2 | None | POINT (718.13118 342.79887) |
| 3 | None | POINT (331.01114 255.68397) |
| 4 | None | POINT (300.08278 600.53525) |
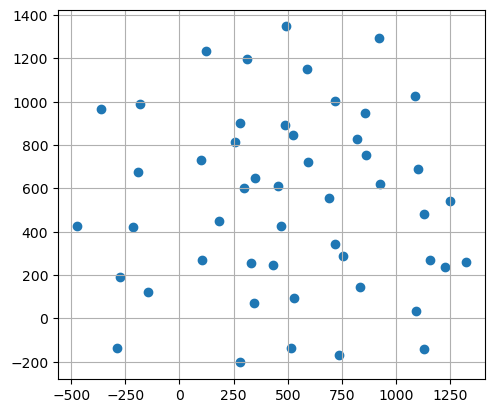
Plotting the Data#
[4]:
gdf.plot(aspect='equal')
plt.grid()

Setting the extent to which the data will be clipped#
[5]:
bbox = [0,972, 0, 1069]
Clipping the data#
The data is clipped with the built-in function clip_by_bbox().
[6]:
gdf_clipped = gg.vector.clip_by_bbox(gdf=gdf,
                                     bbox=bbox)

gdf_clipped.head()
[6]:
| geometry | X | Y | |
|---|---|---|---|
| 0 | POINT (344.32400 73.45078) | 344.32 | 73.45 |
| 1 | POINT (529.46815 95.88742) | 529.47 | 95.89 |
| 2 | POINT (432.04380 246.92094) | 432.04 | 246.92 |
| 3 | POINT (331.01114 255.68397) | 331.01 | 255.68 |
| 4 | POINT (718.13118 342.79887) | 718.13 | 342.80 |
Checking the number of data points#
When printing the lengths of the GeoDataFrames, it can that the number of points was reduced to half.
[7]:
print(len(gdf))
print(len(gdf_clipped))
50
25
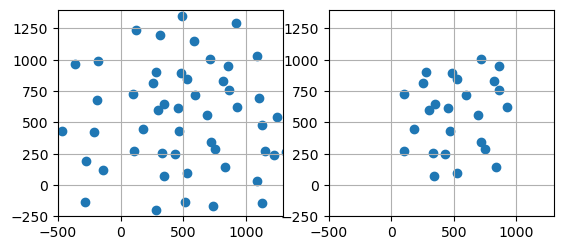
Plotting the data#
By plotting the data, it can be seen that the number of points have been reduced.
[8]:
fig, (ax1, ax2) = plt.subplots(1,2)

gdf.plot(ax=ax1, aspect='equal')
ax1.grid()
ax1.set_xlim(-500, 1300)
ax1.set_ylim(-250, 1400)


gdf_clipped.plot(ax=ax2, aspect='equal')
ax2.grid()
ax2.set_xlim(-500, 1300)
ax2.set_ylim(-250, 1400)
[8]:
(-250.0, 1400.0)
Additional Arguments#
Additional arguments can be passed to the function to reset the index and to drop columns. These arguments are true by default.
[9]:
gdf_clipped = gg.vector.clip_by_bbox(gdf=gdf,
                                     bbox=bbox,
                                     reset_index=True,
                                     drop_index=True,
                                     drop_id=True,
                                     drop_points=True,
                                     drop_level0=True,
                                     drop_level1=True)

gdf_clipped.head()
[9]:
| geometry | X | Y | |
|---|---|---|---|
| 0 | POINT (344.32400 73.45078) | 344.32 | 73.45 |
| 1 | POINT (529.46815 95.88742) | 529.47 | 95.89 |
| 2 | POINT (432.04380 246.92094) | 432.04 | 246.92 |
| 3 | POINT (331.01114 255.68397) | 331.01 | 255.68 |
| 4 | POINT (718.13118 342.79887) | 718.13 | 342.80 |
Clipping Vector Data by a polygon#
[10]:
import geopandas as gpd
import matplotlib.pyplot as plt
import gemgis as gg

gdf = gpd.read_file(file_path + 'randompoints.shp')

gdf.head()
[10]:
| id | geometry | |
|---|---|---|
| 0 | None | POINT (281.52576 902.08681) |
| 1 | None | POINT (925.86670 618.57679) |
| 2 | None | POINT (718.13118 342.79887) |
| 3 | None | POINT (331.01114 255.68397) |
| 4 | None | POINT (300.08278 600.53525) |
Plotting the Data#
[11]:
gdf.plot(aspect='equal')
plt.grid()
Setting the polygon to which the data will be clipped#
[12]:
from shapely.geometry import Polygon

polygon = Polygon([(0,0),(972, 0), (972,1069), (0, 1069)])

polygon.wkt
[12]:
'POLYGON ((0 0, 972 0, 972 1069, 0 1069, 0 0))'
Clipping the data#
The data is clipped with the built-in function clip_by_polygon().
[13]:
gdf_clipped = gg.vector.clip_by_polygon(gdf=gdf,
                                        polygon=polygon)

gdf_clipped.head()
[13]:
| geometry | |
|---|---|
| 0 | POINT (344.32400 73.45078) |
| 1 | POINT (529.46815 95.88742) |
| 2 | POINT (432.04380 246.92094) |
| 3 | POINT (331.01114 255.68397) |
| 4 | POINT (718.13118 342.79887) |
Checking the number of data points#
When printing the lengths of the GeoDataFrames, it can that the number of points was reduced to half.
[14]:
print(len(gdf))
print(len(gdf_clipped))
50
25
Plotting the data#
By plotting the data, it can be seen that the number of points have been reduced.
[15]:
fig, (ax1, ax2) = plt.subplots(1,2)

gdf.plot(ax=ax1, aspect='equal')
ax1.grid()
ax1.set_xlim(-500, 1300)
ax1.set_ylim(-250, 1400)


gdf_clipped.plot(ax=ax2, aspect='equal')
ax2.grid()
ax2.set_xlim(-500, 1300)
ax2.set_ylim(-250, 1400)
[15]:
(-250.0, 1400.0)

Additional Arguments#
Additional arguments can be passed to the function to reset the index and to drop columns. These arguments are true by default.
[16]:
gdf_clipped = gg.vector.clip_by_polygon(gdf=gdf,
                                        polygon=polygon,
                                        reset_index=True,
                                        drop_index=True,
                                        drop_id=True,
                                        drop_points=True,
                                        drop_level0=True,
                                        drop_level1=True)

gdf_clipped.head()
[16]:
| geometry | |
|---|---|
| 0 | POINT (344.32400 73.45078) |
| 1 | POINT (529.46815 95.88742) |
| 2 | POINT (432.04380 246.92094) |
| 3 | POINT (331.01114 255.68397) |
| 4 | POINT (718.13118 342.79887) |
Clipping Raster Data by extent#
[17]:
import rasterio
import gemgis as gg

raster = rasterio.open(file_path + 'raster.tif')

raster.read()
[17]:
array([[[482.82904, 485.51953, 488.159  , ..., 618.8612 , 620.4424 ,
         622.05786],
        [481.6521 , 484.32193, 486.93958, ..., 618.8579 , 620.44556,
         622.06714],
        [480.52563, 483.18893, 485.80444, ..., 618.8688 , 620.4622 ,
         622.08923],
        ...,
        [325.49225, 327.21985, 328.94498, ..., 353.6889 , 360.03125,
         366.3984 ],
        [325.0538 , 326.78473, 328.51276, ..., 351.80603, 357.84106,
         363.96167],
        [324.61444, 326.34845, 328.0794 , ..., 350.09247, 355.87598,
         361.78635]]], dtype=float32)
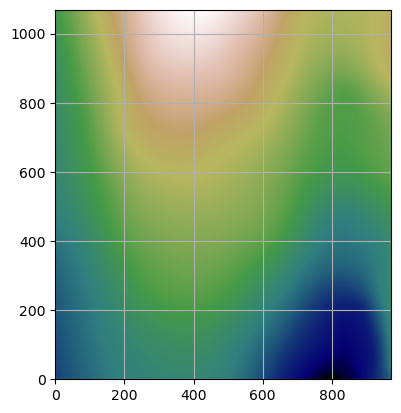
Plotting the input raster#
[18]:
plt.imshow(raster.read(1), cmap='gist_earth', extent= [0,972,0,1069])
plt.grid()
Setting the extent to which the data will be clipped#
[19]:
bbox = [250,750,250,750]
Clipping the raster#
The data is clipped with the built-in function clip_by_bbox().
[20]:
raster_clipped = gg.raster.clip_by_bbox(raster=raster,
                                        bbox=bbox)
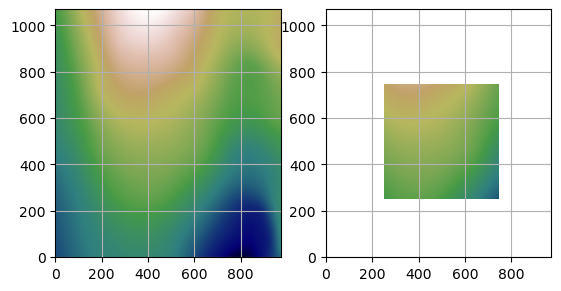
Plotting the result#
[21]:
fig, (ax1, ax2) = plt.subplots(1,2)

ax1.imshow(raster.read(1), cmap='gist_earth', extent= [0,972,0,1069], vmin=250, vmax=750)
ax1.grid()
ax1.set_xlim(0,972)
ax1.set_ylim(0,1069)


ax2.imshow(raster_clipped, cmap='gist_earth', extent= [250,750,250,750], vmin=250, vmax=750)
ax2.grid()
ax2.set_xlim(0, 972)
ax2.set_ylim(0, 1069)
[21]:
(0.0, 1069.0)
Additional Arguments#
Additional arguments can be passed to directly save the clipped raster to disc.
[22]:
raster_clipped = gg.raster.clip_by_bbox(raster=raster,
                                        bbox=bbox,
                                        raster_extent=None,
                                        save_clipped_raster=False,
                                        path='raster_clipped.tif')
Clipping Raster Data by polygon#
[23]:
import rasterio
import gemgis as gg

raster = rasterio.open(file_path + 'raster.tif')
Plotting the input raster#
[24]:
plt.imshow(raster.read(1), cmap='gist_earth', extent= [0,972,0,1069])
plt.grid()

Setting the extent to which the data will be clipped#
[25]:
from shapely.geometry import Polygon

polygon = Polygon([(250,250),(750,250), (750,750), (250, 750)])

polygon
[25]:

Clipping the raster#
The data is clipped with the built-in function clip_by_bbox().
[26]:
raster_clipped = gg.raster.clip_by_polygon(raster=raster,
                                           polygon=polygon)
Plotting the result#
[27]:
fig, (ax1, ax2) = plt.subplots(1,2)

ax1.imshow(raster.read(1), cmap='gist_earth', extent= [0,972,0,1069], vmin=250, vmax=750)
ax1.grid()
ax1.set_xlim(0,972)
ax1.set_ylim(0,1069)


ax2.imshow(raster_clipped, cmap='gist_earth', extent= [250,750,250,750], vmin=250, vmax=750)
ax2.grid()
ax2.set_xlim(0, 972)
ax2.set_ylim(0, 1069)
[27]:
(0.0, 1069.0)

Additional Arguments#
Additional arguments can be passed to directly save the clipped raster to disc.
[28]:
raster_clipped = gg.raster.clip_by_polygon(raster=raster,
                                           polygon=polygon,
                                           raster_extent=None,
                                           save_clipped_raster=False,
                                           path='raster_clipped.tif')