07 Calculating Raster Properties
Contents
07 Calculating Raster Properties#
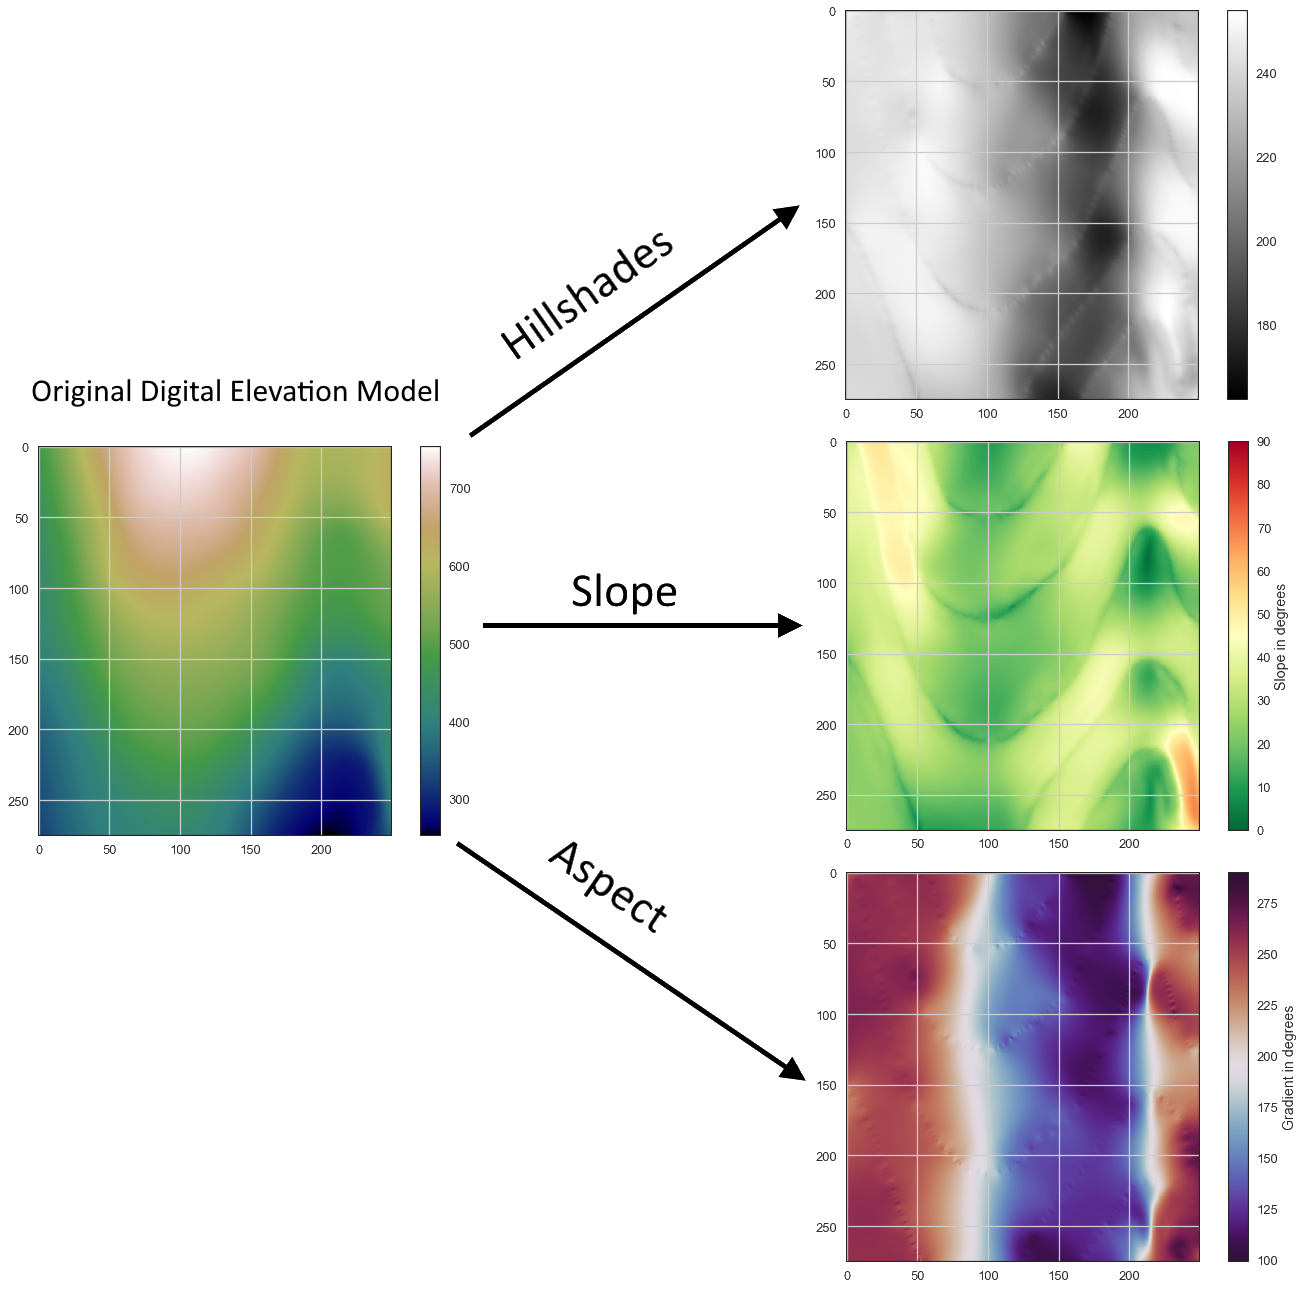
Raster properties such as hillshades for better visualization of the digital elevation model and slope/aspect for the calculation of orientation values can easily be calculated in GemGIS. Hillshades are a 3D grayscale representation of the topography defined by a light source with a given azimuth and altitude. The slope defines the gradient of the raster and the aspect defines the direction of the gradient. Hence, the combination of both paramters results in an orientation value.
Set File Paths and download Tutorial Data#
If you downloaded the latest GemGIS version from the Github repository, append the path so that the package can be imported successfully. Otherwise, it is recommended to install GemGIS via pip install gemgis and import GemGIS using import gemgis as gg. In addition, the file path to the folder where the data is being stored is set. The tutorial data is downloaded using Pooch (https://www.fatiando.org/pooch/latest/index.html) and stored in the specified folder. Use
pip install pooch if Pooch is not installed on your system yet.
[1]:
import gemgis as gg

file_path ='data/07_calculating_raster_properties/'
[2]:
gg.download_gemgis_data.download_tutorial_data(filename="07_calculating_raster_properties.zip", dirpath=file_path)
Downloading file '07_calculating_raster_properties.zip' from 'https://rwth-aachen.sciebo.de/s/AfXRsZywYDbUF34/download?path=%2F07_calculating_raster_properties.zip' to 'C:\Users\ale93371\Documents\gemgis\docs\getting_started\tutorial\data\07_calculating_raster_properties'.
Loading the raster#
[3]:
import rasterio

raster = rasterio.open(file_path + 'raster.tif')
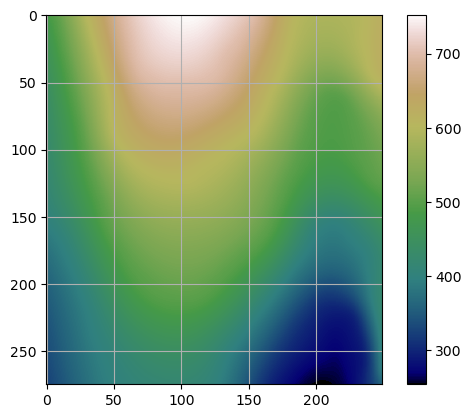
Plotting the raster#
[4]:
import matplotlib.pyplot as plt

im = plt.imshow(raster.read(1), cmap='gist_earth')
plt.grid()
plt.colorbar(im)
[4]:
<matplotlib.colorbar.Colorbar at 0x24793033fd0>
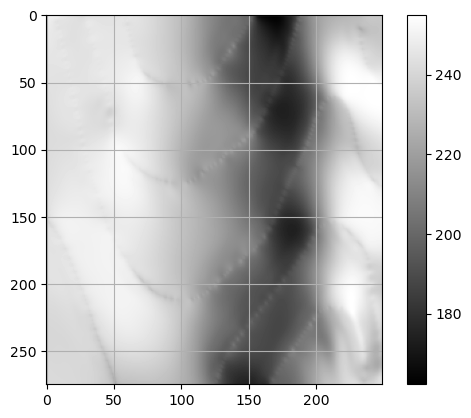
Calculate hillshades#
The hillshades can be calculated using calculate_hillshades(..).
[5]:
hillshades = gg.raster.calculate_hillshades(raster)
Plotting hillshades#
[6]:
im = plt.imshow(hillshades, cmap='gray')
plt.grid()
plt.colorbar(im)
[6]:
<matplotlib.colorbar.Colorbar at 0x247942e96c0>
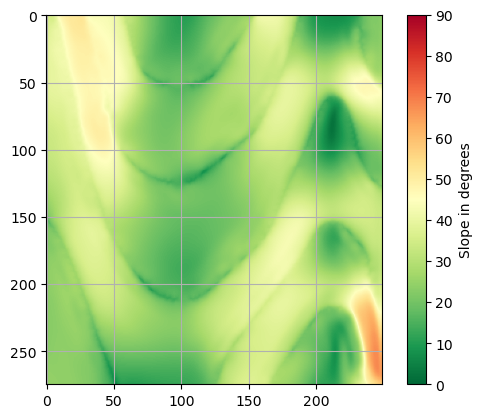
Calculate slope#
The slope can be calculated using calculate_slope(..).
[7]:
slope = gg.raster.calculate_slope(raster)
Plotting hillshades#
[8]:
im = plt.imshow(slope, cmap='RdYlGn_r', vmin=0, vmax=90)
plt.grid()
cbar = plt.colorbar(im)
cbar.set_label('Slope in degrees')
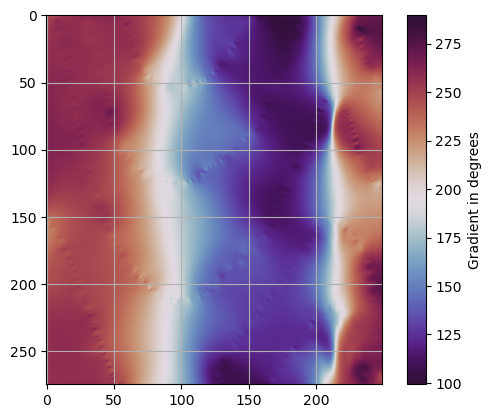
Calculate aspect#
The aspect can be calculated using calculate_aspect(..).
[9]:
aspect = gg.raster.calculate_aspect(raster)
Plotting hillshades#
[10]:
im = plt.imshow(aspect, cmap='twilight_shifted')
plt.grid()
cbar = plt.colorbar(im)
cbar.set_label('Gradient in degrees')