
05 Interpolating Rasters
Contents
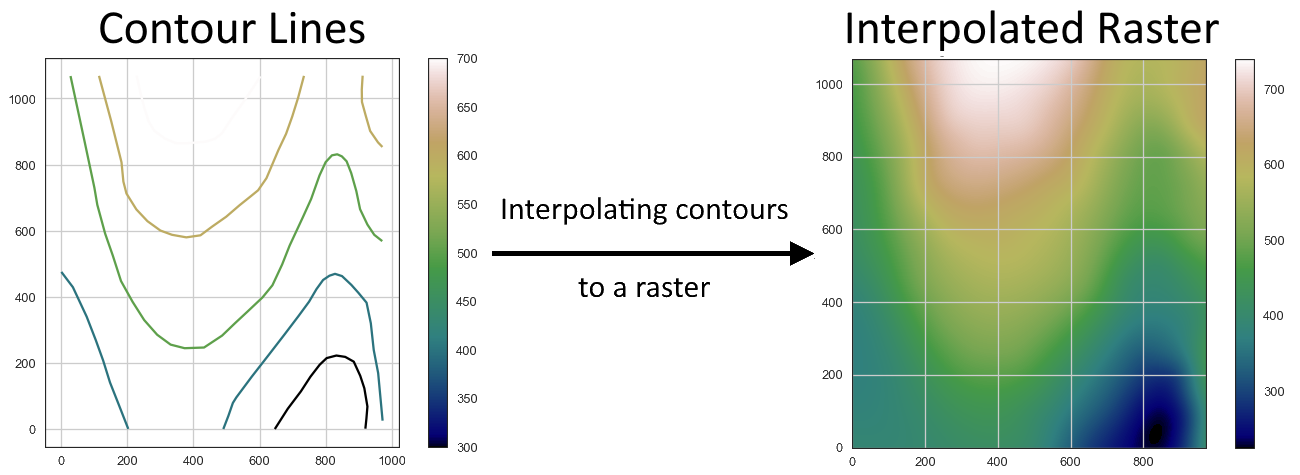
05 Interpolating Rasters#
In case the digital elevation model of a simple geological map needs to be interpolated from topographic contours, several methods have been implemented in GemGIS. These include the methods nearest, cubic and linear of scipy.interpolate.griddata and Rbf of scipy.interpolate.rbf. The different methods can be accessed by passing the argument method= 'method_name'. More information about the interpolation methods can be found
here.
Set File Paths and download Tutorial Data#
If you downloaded the latest GemGIS version from the Github repository, append the path so that the package can be imported successfully. Otherwise, it is recommended to install GemGIS via pip install gemgis and import GemGIS using import gemgis as gg. In addition, the file path to the folder where the data is being stored is set. The tutorial data is downloaded using Pooch (https://www.fatiando.org/pooch/latest/index.html) and stored in the specified folder. Use
pip install pooch if Pooch is not installed on your system yet.
[1]:
import gemgis as gg

file_path ='data/05_interpolating_rasters/'
[2]:
gg.download_gemgis_data.download_tutorial_data(filename="05_interpolating_rasters.zip", dirpath=file_path)
Downloading file '05_interpolating_rasters.zip' from 'https://rwth-aachen.sciebo.de/s/AfXRsZywYDbUF34/download?path=%2F05_interpolating_rasters.zip' to 'C:\Users\ale93371\Documents\gemgis\docs\getting_started\tutorial\data\05_interpolating_rasters'.
Loading Data#
[3]:
import geopandas as gpd

contours = gpd.read_file(file_path + 'topo.shp')

contours.head()
[3]:
| id | Z | geometry | |
|---|---|---|---|
| 0 | None | 400 | LINESTRING (0.74088 475.44101, 35.62873 429.24... |
| 1 | None | 300 | LINESTRING (645.96500 0.52496, 685.14093 61.86... |
| 2 | None | 400 | LINESTRING (490.29223 0.52496, 505.75641 40.73... |
| 3 | None | 600 | LINESTRING (911.43347 1068.58451, 908.85610 10... |
| 4 | None | 700 | LINESTRING (228.43207 1068.58451, 239.77247 10... |
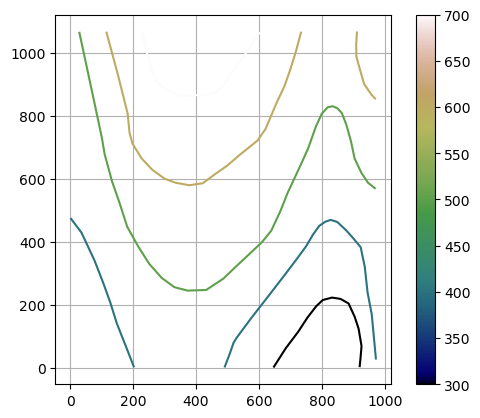
Plotting Data#
[4]:
import matplotlib.pyplot as plt

contours.plot(aspect='equal',column='Z', cmap='gist_earth', legend=True)
plt.grid()
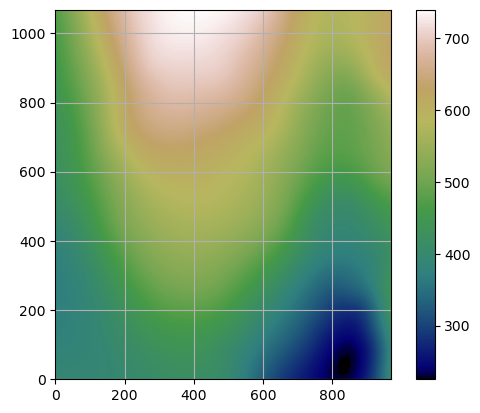
Interpolating the Raster#
It is recommended to use the method rbf for the interpolation of contour lines. More information about RBF can be found here in this paper.
[5]:
raster = gg.vector.interpolate_raster(gdf=contours,
                                      method='rbf')
raster[:2]
[5]:
array([[393.56371914, 393.50838517, 393.45386851, ..., 396.15856133,
        398.11421775, 400.06334288],
       [393.41982945, 393.36494644, 393.31088433, ..., 396.20694282,
        398.16690286, 400.12027997]])
Plotting the interpolated raster#
[6]:
im = plt.imshow(raster, cmap='gist_earth', origin='lower')
plt.grid()
plt.colorbar(im)
[6]:
<matplotlib.colorbar.Colorbar at 0x21cf685bac0>
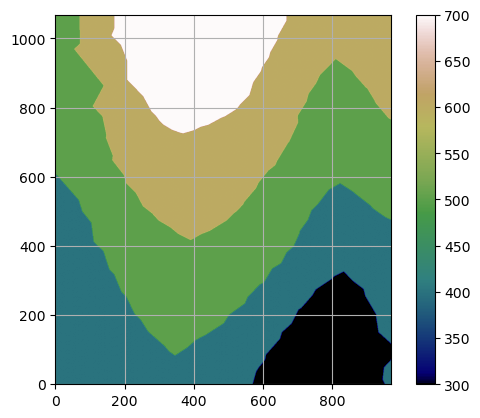
Interpolating the Raster#
Using different interpolation functions such as nearest will result in different, more unrealistic results.
[7]:
raster = gg.vector.interpolate_raster(gdf=contours,
                                      method='nearest')
Plotting the interpolated raster#
[8]:
im = plt.imshow(raster, cmap='gist_earth', origin='lower')
plt.grid()
plt.colorbar(im)
[8]:
<matplotlib.colorbar.Colorbar at 0x21cf68ba590>
Additional Arguments#
Several additional arguments can be passed to adapt the functionality of the function. For further reference, see the API Reference for extract_xy.
n - Number of points, default all
res - Resolution of the interpolated raster, default 1
extent - Extent of the interpolated raster, default according to the input data
seed - seed for drawing random values
kwargs - optional keyword arguments for rbf and griddata interpolation functions - https://docs.scipy.org/doc/scipy/reference/interpolate.html