61 Exporting Geological Maps and Custom sections from GemPy
Contents
61 Exporting Geological Maps and Custom sections from GemPy#
Set File Paths and download Tutorial Data#
If you downloaded the latest GemGIS version from the Github repository, append the path so that the package can be imported successfully. Otherwise, it is recommended to install GemGIS via pip install gemgis and import GemGIS using import gemgis as gg. In addition, the file path to the folder where the data is being stored is set. The tutorial data is downloaded using Pooch (https://www.fatiando.org/pooch/latest/index.html) and stored in the specified folder. Use
pip install pooch if Pooch is not installed on your system yet.
[22]:
import gemgis as gg

file_path ='data/61_Exporting_geological_map_and_custom_sections_from_GemPy/'
gg.download_gemgis_data.download_tutorial_data(filename="61_Exporting_geological_map_and_custom_sections_from_GemPy.zip", dirpath=file_path)
Loading the data#
[23]:
import geopandas as gpd
import rasterio

interfaces = gpd.read_file(file_path + 'interfaces.shp')
orientations = gpd.read_file(file_path + 'orientations.shp')
extent = [0,972,0,1069, 300, 800]
resolution = [50, 50, 50]
[24]:
interfaces.head()
[24]:
| level_0 | level_1 | formation | X | Y | Z | geometry | |
|---|---|---|---|---|---|---|---|
| 0 | 0 | 0 | Sand1 | 0.26 | 264.86 | 353.97 | POINT (0.25633 264.86215) |
| 1 | 0 | 0 | Sand1 | 10.59 | 276.73 | 359.04 | POINT (10.59347 276.73371) |
| 2 | 0 | 0 | Sand1 | 17.13 | 289.09 | 364.28 | POINT (17.13494 289.08982) |
| 3 | 0 | 0 | Sand1 | 19.15 | 293.31 | 364.99 | POINT (19.15013 293.31349) |
| 4 | 0 | 0 | Sand1 | 27.80 | 310.57 | 372.81 | POINT (27.79512 310.57169) |
[25]:
orientations['polarity'] = 1
orientations.head()
[25]:
| formation | dip | azimuth | X | Y | Z | geometry | polarity | |
|---|---|---|---|---|---|---|---|---|
| 0 | Ton | 30.50 | 180.00 | 96.47 | 451.56 | 477.73 | POINT (96.47104 451.56362) | 1 |
| 1 | Ton | 30.50 | 180.00 | 172.76 | 661.88 | 481.73 | POINT (172.76101 661.87650) | 1 |
| 2 | Ton | 30.50 | 180.00 | 383.07 | 957.76 | 444.45 | POINT (383.07389 957.75787) | 1 |
| 3 | Ton | 30.50 | 180.00 | 592.36 | 722.70 | 480.57 | POINT (592.35583 722.70229) | 1 |
| 4 | Ton | 30.50 | 180.00 | 766.59 | 348.47 | 498.96 | POINT (766.58562 348.46907) | 1 |
Creating the GemPy Model#
[26]:
import sys
sys.path.append('../../../../gempy-master')
import gempy as gp
[27]:
geo_model = gp.create_model('Model1')
geo_model
[27]:
Model1 2023-05-08 12:52
Initiating the Model#
[28]:
import pandas as pd

gp.init_data(geo_model, extent, resolution,
             surface_points_df = interfaces,
             orientations_df = orientations,
             default_values=True)
geo_model.surfaces
Active grids: ['regular']
[28]:
| surface | series | order_surfaces | color | id | |
|---|---|---|---|---|---|
| 0 | Sand1 | Default series | 1 | #015482 | 1 |
| 1 | Ton | Default series | 2 | #9f0052 | 2 |
The vertices and edges are currently NaN values, so no model has been computed so far.
[29]:
geo_model.surfaces.df
[29]:
| surface | series | order_surfaces | isBasement | isFault | isActive | hasData | color | vertices | edges | sfai | id | |
|---|---|---|---|---|---|---|---|---|---|---|---|---|
| 0 | Sand1 | Default series | 1 | False | False | True | True | #015482 | NaN | NaN | NaN | 1 |
| 1 | Ton | Default series | 2 | True | False | True | True | #9f0052 | NaN | NaN | NaN | 2 |
Mapping Stack to Surfaces#
[30]:
gp.map_stack_to_surfaces(geo_model,
                         {"Strat_Series": ('Sand1', 'Ton')},
                         remove_unused_series=True)
geo_model.add_surfaces('basement')
[30]:
| surface | series | order_surfaces | color | id | |
|---|---|---|---|---|---|
| 0 | Sand1 | Strat_Series | 1 | #015482 | 1 |
| 1 | Ton | Strat_Series | 2 | #9f0052 | 2 |
| 2 | basement | Strat_Series | 3 | #ffbe00 | 3 |
Loading the Topography#
[31]:
geo_model.set_topography(
    source='gdal', filepath='data/61_Exporting_geological_map_and_custom_sections_from_GemPy/raster1.tif')
Cropped raster to geo_model.grid.extent.
depending on the size of the raster, this can take a while...
storing converted file...
Active grids: ['regular' 'topography']
[31]:
Grid Object. Values:
array([[   9.72      ,   10.69      ,  305.        ],
       [   9.72      ,   10.69      ,  315.        ],
       [   9.72      ,   10.69      ,  325.        ],
       ...,
       [ 970.056     , 1059.28181818,  622.0892334 ],
       [ 970.056     , 1063.16909091,  622.06713867],
       [ 970.056     , 1067.05636364,  622.05786133]])
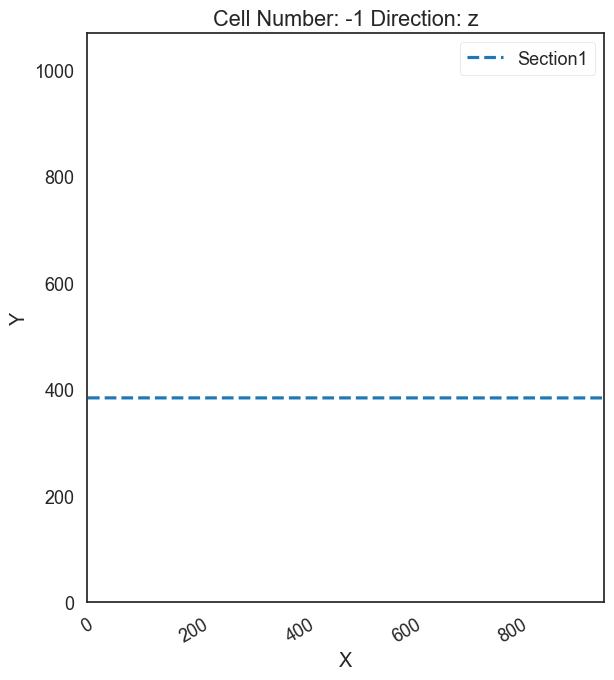
Defining Custom Section#
[32]:
custom_section = gpd.read_file(file_path + 'customsections1.shp')
custom_section_dict = gg.utils.to_section_dict(custom_section, section_column='section')
geo_model.set_section_grid(custom_section_dict)
Active grids: ['regular' 'topography' 'sections']
[32]:
| start | stop | resolution | dist | |
|---|---|---|---|---|
| Section1 | [1.372395262185787, 383.9794474025771] | [970.9954955186289, 383.8831909730347] | [100, 80] | 969.62 |
[33]:
gp.plot.plot_section_traces(geo_model)
[33]:
<gempy.plot.visualization_2d.Plot2D at 0x2b0f5226bb0>
Setting Interpolator#
[34]:
gp.set_interpolator(geo_model,
                    compile_theano=True,
                    theano_optimizer='fast_compile',
                    verbose=[],
                    update_kriging = False
                    )
Compiling theano function...
Level of Optimization:  fast_compile
Device:  cpu
Precision:  float64
Number of faults:  0
Compilation Done!
Kriging values:
                   values
range            1528.90
$C_o$           55655.83
drift equations      [3]
[34]:
<gempy.core.interpolator.InterpolatorModel at 0x2b0f52261c0>
Computing Model#
[35]:
sol = gp.compute_model(geo_model, compute_mesh=True)
The surfaces DataFrame now contains values for vertices and edges.
[36]:
geo_model.surfaces.df
[36]:
| surface | series | order_surfaces | isBasement | isFault | isActive | hasData | color | vertices | edges | sfai | id | |
|---|---|---|---|---|---|---|---|---|---|---|---|---|
| 0 | Sand1 | Strat_Series | 1 | False | False | True | True | #015482 | [[29.160000000000004, 194.27877317428587, 305.... | [[2, 1, 0], [2, 0, 3], [3, 4, 2], [2, 4, 5], [... | 0.26 | 1 |
| 1 | Ton | Strat_Series | 2 | False | False | True | True | #9f0052 | [[29.160000000000004, 365.78652999877926, 305.... | [[2, 1, 0], [2, 0, 3], [3, 4, 2], [2, 4, 5], [... | 0.21 | 2 |
| 2 | basement | Strat_Series | 3 | True | False | True | True | #ffbe00 | NaN | NaN | NaN | 3 |
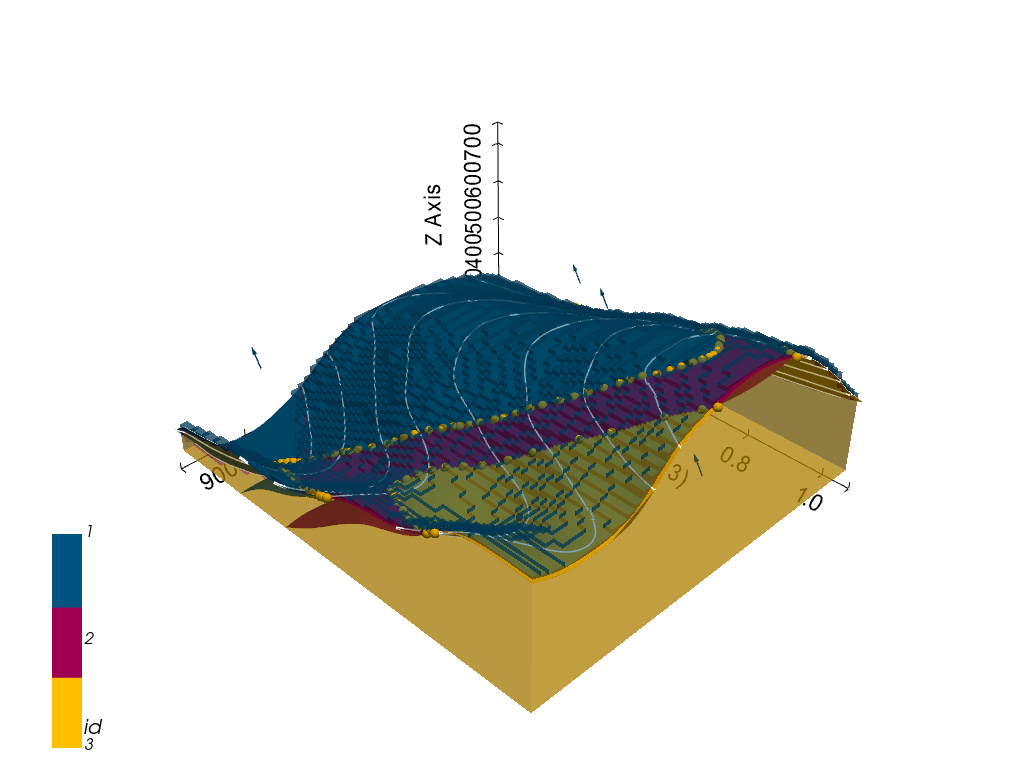
Plotting the 3D Model#
[37]:
gpv = gp.plot_3d(geo_model, image=False, show_topography=True,
                 plotter_type='basic', notebook=True, show_lith=True)
C:\Users\jan13846\.conda\envs\gemgis\lib\site-packages\pyvista\plotting\tools.py:571: PyvistaDeprecationWarning: The usage of `parse_color` is deprecated in favor of the new `Color` class.
  warnings.warn(
C:\Users\jan13846\.conda\envs\gemgis\lib\site-packages\pyvista\jupyter\notebook.py:60: UserWarning: Failed to use notebook backend:

Please install `ipyvtklink` to use this feature: https://github.com/Kitware/ipyvtklink

Falling back to a static output.
  warnings.warn(
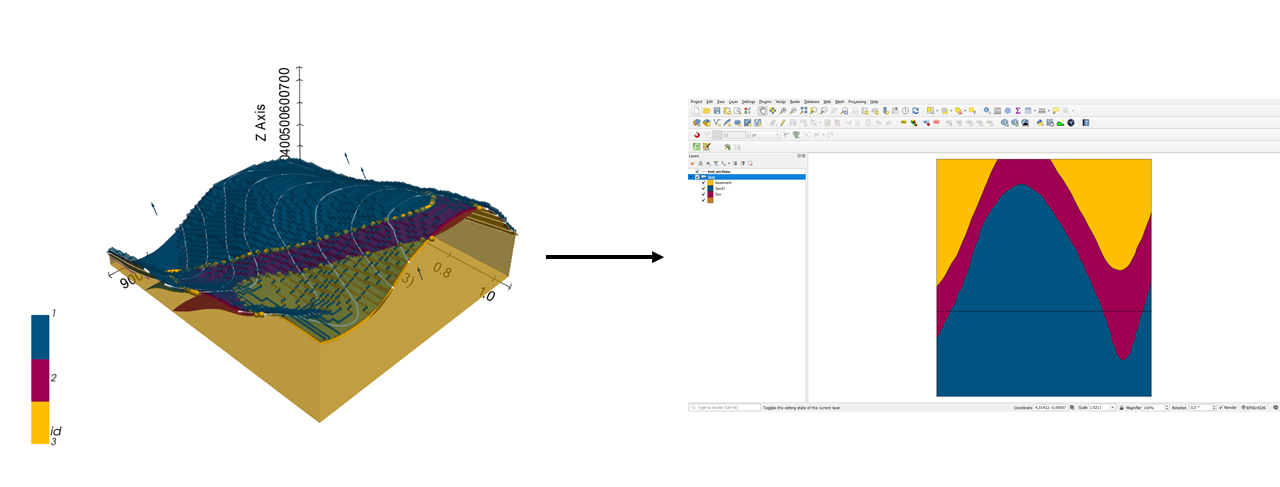
Extracting Shapefiles from Gempy model#
Using the following code we are able to download the custom sections and the geological map as shapefiles
Extracting GemPy Section Lines as Shapefiles#
[38]:
from shapely.geometry import LineString
gdf_sections = geo_model.grid.sections.df.copy(deep=True)
gdf_sections.reset_index()
linestrings = [LineString((gdf_sections.iloc[i]['start'],gdf_sections.iloc[i]['stop'] )) for i in range(len(gdf_sections))]
gdf_sections_new = gpd.GeoDataFrame(geometry=linestrings, data= gdf_sections.reset_index()[['index']], crs='EPSG:32632')
gdf_sections_new.to_file(file_path + 'test_sections.shp')
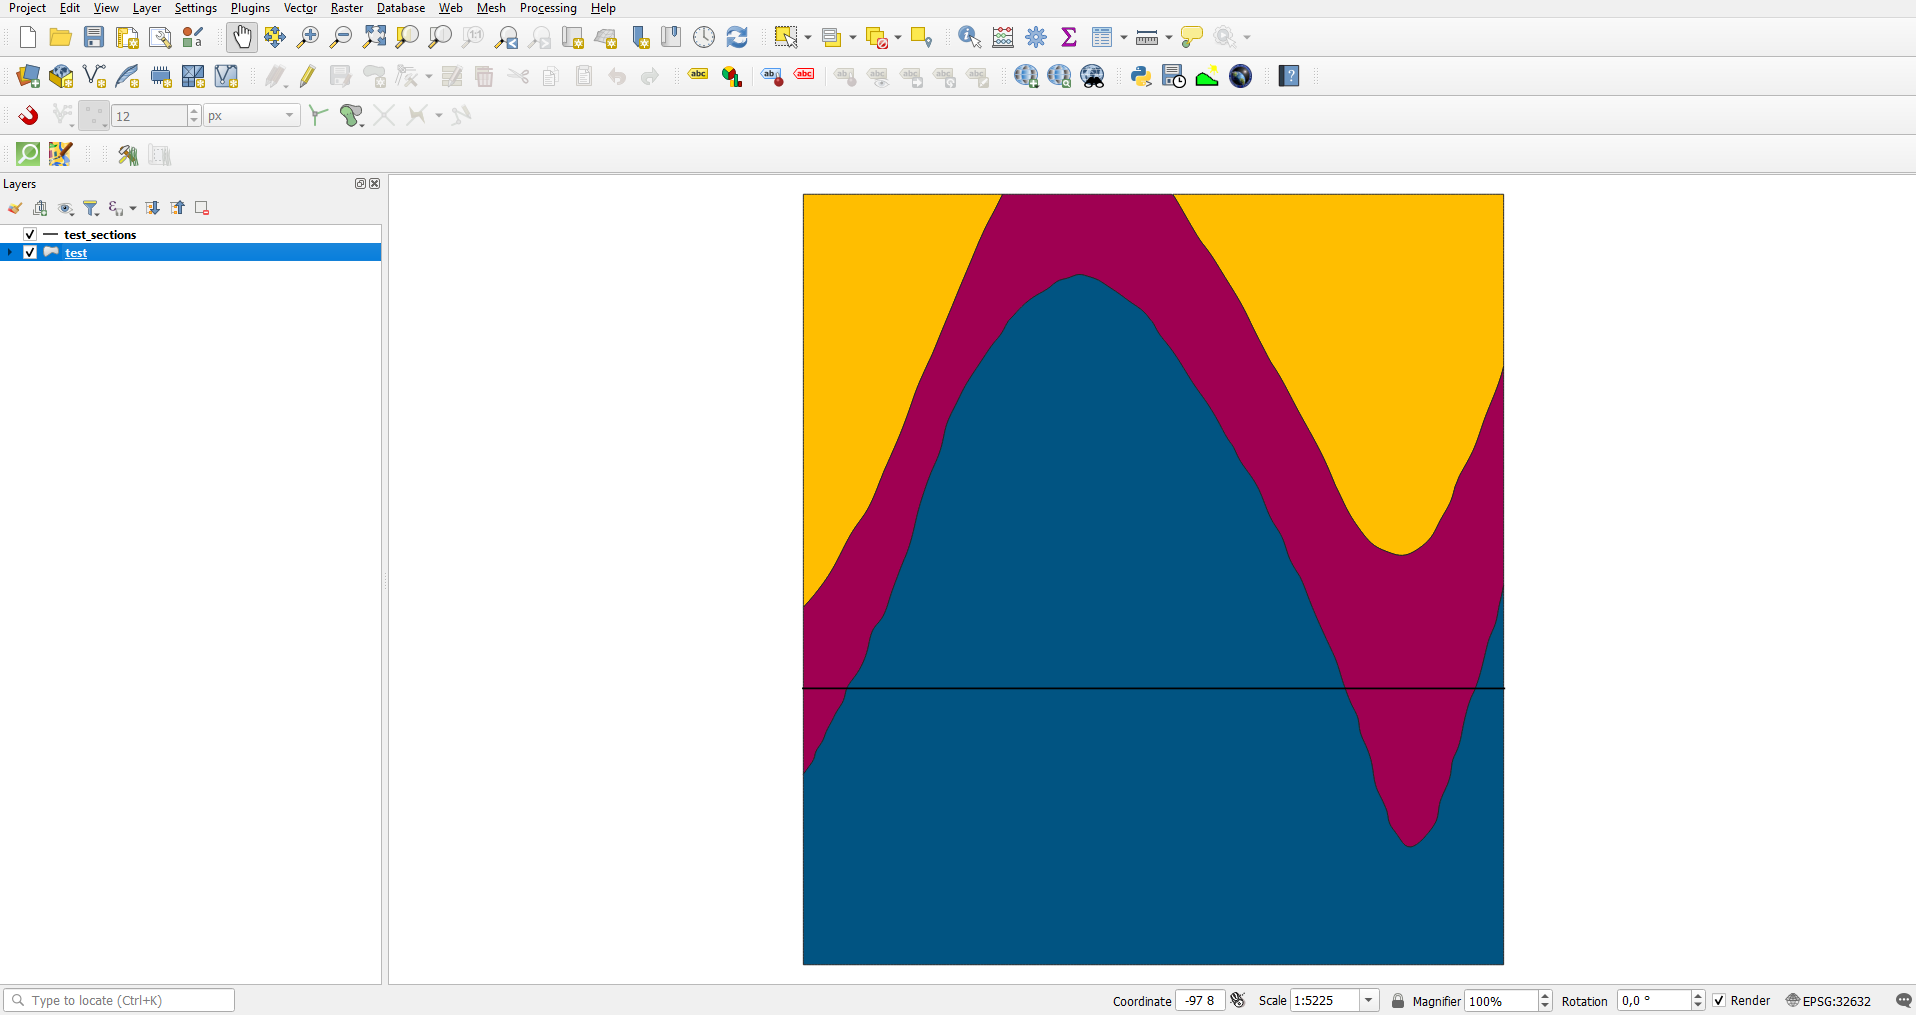
Extracting GemPy Geological Map Polygons as Shapefiles#
[39]:
gdf = gg.postprocessing.extract_lithologies(geo_model, geo_model.grid.regular_grid.extent[:4], crs='EPSG:32632')
gdf.to_file(file_path + 'test.shp')