56 Displaying Seismic Data in PyVista
Contents
56 Displaying Seismic Data in PyVista#
The following notebooks illustrates how to display publicly available seismic data loaded with segysak and visualized using PyVista.
Set File Paths and download Tutorial Data#
If you downloaded the latest GemGIS version from the Github repository, append the path so that the package can be imported successfully. Otherwise, it is recommended to install GemGIS via pip install gemgis and import GemGIS using import gemgis as gg. In addition, the file path to the folder where the data is being stored is set. The tutorial data is downloaded using Pooch (https://www.fatiando.org/pooch/latest/index.html) and stored in the specified folder. Use
pip install pooch if Pooch is not installed on your system yet.
[1]:
import warnings
warnings.filterwarnings("ignore")

# import gemgis as gg

from segysak.segy import segy_loader

import numpy as np

from matplotlib.colors import ListedColormap

import matplotlib as mpl
import matplotlib.pyplot as plt

import pyvista as pv

from shapely.geometry import LineString
Conflict between GeoPandas and Segysak#
Importing gemgis and its dependencies together with segysak will result in an ImportError. Therefore, please comment the segysak import, import gemgis, download the data, restart the notebook, comment the gemgis import and uncomment the segysak import to continue running the notebook.
[2]:
file_path ='data/56_displaying_seismic_data_in_pyvista/'
# gg.download_gemgis_data.download_tutorial_data(filename="56_displaying_seismic_data_in_pyvista.zip", dirpath=file_path)
Loading Seismic Data#
The used seismic data can be freely downloaded from https://www.nlog.nl/en/scan-2d-seismic-data and https://www.nlog.nl/en/map-2d-seismic-data. It will be opened using the segysak package (https://segysak.readthedocs.io/en/latest/).
We are loading the recently acquired SCAN Seismic Line 29 as xarray object. The remaining SCAN Line 20 as well as the Seismic Lines shot within the Framework of the Californie Geothermal project will be loaded directly as vtk file for the final plotting. All data have been prepared the same way as shown here in this notebook.
[3]:
scan29 = segy_loader(file_path+'L2EBN2020ASCAN029_PreSTM_final_full_AGC.sgy', vert_domain="TWT")
scan29
Loading as 2D
[3]:
<xarray.Dataset>
Dimensions:  (cdp: 19393, twt: 5001)
Coordinates:
  * cdp      (cdp) uint16 100 101 102 103 104 ... 19488 19489 19490 19491 19492
  * twt      (twt) float64 0.0 2.0 4.0 6.0 ... 9.996e+03 9.998e+03 1e+04
    cdp_x    (cdp) float32 1.697e+05 1.697e+05 1.697e+05 ... 2.164e+05 2.164e+05
    cdp_y    (cdp) float32 3.753e+05 3.753e+05 3.753e+05 ... 3.874e+05 3.874e+05
Data variables:
    data     (cdp, twt) float32 0.0 0.03689 -0.05879 -0.3133 ... 0.0 0.0 0.0 0.0
Attributes: (12/13)
    ns:                  None
    sample_rate:         2.0
    text:                C01 CLIENT: EBN              AREA: SCAN AREAS, NETHE...
    measurement_system:  m
    d3_domain:           None
    epsg:                None
    ...                  ...
    corner_points_xy:    None
    source_file:         L2EBN2020ASCAN029_PreSTM_final_full_AGC.sgy
    srd:                 None
    datatype:            None
    percentiles:         [-4.339022828226371, -3.723384707669676, -0.46175039...
coord_scalar: -100.0Converting xarray to DataFrame#
The xarray datasets are converted to Pandas DataFrames using the built-in to_dataframe() function. The DataFrame contains the X and Y data for every CDP as well as the data value for every sample.
[4]:
df_scan29 = scan29.to_dataframe()
df_scan29
[4]:
| data | cdp_x | cdp_y | ||
|---|---|---|---|---|
| cdp | twt | |||
| 100 | 0.0 | 0.000000 | 169653.796875 | 375267.0000 |
| 2.0 | 0.036886 | 169653.796875 | 375267.0000 | |
| 4.0 | -0.058794 | 169653.796875 | 375267.0000 | |
| 6.0 | -0.313349 | 169653.796875 | 375267.0000 | |
| 8.0 | -0.186058 | 169653.796875 | 375267.0000 | |
| ... | ... | ... | ... | ... |
| 19492 | 9992.0 | 0.000000 | 216394.500000 | 387366.1875 |
| 9994.0 | 0.000000 | 216394.500000 | 387366.1875 | |
| 9996.0 | 0.000000 | 216394.500000 | 387366.1875 | |
| 9998.0 | 0.000000 | 216394.500000 | 387366.1875 | |
| 10000.0 | 0.000000 | 216394.500000 | 387366.1875 |
96984393 rows × 3 columns
Define Seismic colorbar#
The seismic colorbar was obtained from https://github.com/lperozzi/Seismic_colormaps/blob/master/colormaps.py and will be used to display the seismic properly in PyVista.
[5]:
seismic = np.array([[0.63137255, 1.        , 1.        ],
       [0.62745098, 0.97647059, 0.99607843],
       [0.61960784, 0.95686275, 0.98823529],
       [0.61568627, 0.93333333, 0.98431373],
       [0.60784314, 0.91372549, 0.98039216],
       [0.60392157, 0.89019608, 0.97254902],
       [0.59607843, 0.87058824, 0.96862745],
       [0.59215686, 0.85098039, 0.96078431],
       [0.58431373, 0.83137255, 0.95686275],
       [0.58039216, 0.81568627, 0.94901961],
       [0.57254902, 0.79607843, 0.94117647],
       [0.56862745, 0.77647059, 0.9372549 ],
       [0.56078431, 0.76078431, 0.92941176],
       [0.55686275, 0.74509804, 0.92156863],
       [0.54901961, 0.72941176, 0.91764706],
       [0.54509804, 0.70980392, 0.90980392],
       [0.5372549 , 0.69411765, 0.90196078],
       [0.53333333, 0.68235294, 0.89803922],
       [0.5254902 , 0.66666667, 0.89019608],
       [0.52156863, 0.65098039, 0.88235294],
       [0.51372549, 0.63921569, 0.87843137],
       [0.50980392, 0.62352941, 0.87058824],
       [0.50196078, 0.61176471, 0.8627451 ],
       [0.49803922, 0.59607843, 0.85490196],
       [0.49411765, 0.58431373, 0.85098039],
       [0.48627451, 0.57254902, 0.84313725],
       [0.48235294, 0.56078431, 0.83529412],
       [0.47843137, 0.54901961, 0.82745098],
       [0.4745098 , 0.54117647, 0.82352941],
       [0.46666667, 0.52941176, 0.81568627],
       [0.4627451 , 0.51764706, 0.80784314],
       [0.45882353, 0.50980392, 0.8       ],
       [0.45490196, 0.49803922, 0.79607843],
       [0.45098039, 0.49019608, 0.78823529],
       [0.44705882, 0.48235294, 0.78039216],
       [0.44313725, 0.4745098 , 0.77254902],
       [0.43921569, 0.46666667, 0.76862745],
       [0.43529412, 0.45882353, 0.76078431],
       [0.43529412, 0.45098039, 0.75294118],
       [0.43137255, 0.44313725, 0.74901961],
       [0.42745098, 0.43529412, 0.74117647],
       [0.42352941, 0.43137255, 0.7372549 ],
       [0.42352941, 0.42352941, 0.72941176],
       [0.41960784, 0.41960784, 0.72156863],
       [0.41960784, 0.41176471, 0.71764706],
       [0.41568627, 0.40784314, 0.70980392],
       [0.41568627, 0.4       , 0.70588235],
       [0.41176471, 0.39607843, 0.69803922],
       [0.41176471, 0.39215686, 0.69411765],
       [0.41176471, 0.38823529, 0.68627451],
       [0.40784314, 0.38431373, 0.68235294],
       [0.40784314, 0.38039216, 0.67843137],
       [0.40784314, 0.38039216, 0.67058824],
       [0.40784314, 0.37647059, 0.66666667],
       [0.40784314, 0.37254902, 0.6627451 ],
       [0.40392157, 0.37254902, 0.65490196],
       [0.40392157, 0.36862745, 0.65098039],
       [0.40392157, 0.36862745, 0.64705882],
       [0.40392157, 0.36470588, 0.64313725],
       [0.40784314, 0.36470588, 0.63529412],
       [0.40784314, 0.36470588, 0.63137255],
       [0.40784314, 0.36078431, 0.62745098],
       [0.40784314, 0.36078431, 0.62352941],
       [0.40784314, 0.36078431, 0.61960784],
       [0.40784314, 0.36078431, 0.61568627],
       [0.41176471, 0.36078431, 0.61176471],
       [0.41176471, 0.36078431, 0.60784314],
       [0.41176471, 0.36470588, 0.60392157],
       [0.41568627, 0.36470588, 0.60392157],
       [0.41568627, 0.36470588, 0.6       ],
       [0.41960784, 0.36862745, 0.59607843],
       [0.41960784, 0.36862745, 0.59215686],
       [0.42352941, 0.36862745, 0.59215686],
       [0.42352941, 0.37254902, 0.58823529],
       [0.42745098, 0.37647059, 0.58431373],
       [0.43137255, 0.37647059, 0.58431373],
       [0.43137255, 0.38039216, 0.58039216],
       [0.43529412, 0.38431373, 0.58039216],
       [0.43921569, 0.38823529, 0.57647059],
       [0.44313725, 0.39215686, 0.57647059],
       [0.44705882, 0.39607843, 0.57647059],
       [0.44705882, 0.4       , 0.57254902],
       [0.45098039, 0.40392157, 0.57254902],
       [0.45490196, 0.40784314, 0.57254902],
       [0.45882353, 0.41176471, 0.57254902],
       [0.4627451 , 0.41568627, 0.57254902],
       [0.46666667, 0.41960784, 0.57254902],
       [0.47058824, 0.42745098, 0.57254902],
       [0.4745098 , 0.43137255, 0.57254902],
       [0.48235294, 0.43529412, 0.57254902],
       [0.48627451, 0.44313725, 0.57254902],
       [0.49019608, 0.44705882, 0.57254902],
       [0.49411765, 0.45490196, 0.57254902],
       [0.50196078, 0.4627451 , 0.57647059],
       [0.50588235, 0.46666667, 0.57647059],
       [0.50980392, 0.4745098 , 0.58039216],
       [0.51764706, 0.48235294, 0.58039216],
       [0.52156863, 0.49019608, 0.58431373],
       [0.52941176, 0.49803922, 0.58431373],
       [0.53333333, 0.50196078, 0.58823529],
       [0.54117647, 0.50980392, 0.59215686],
       [0.54509804, 0.51764706, 0.59607843],
       [0.55294118, 0.52941176, 0.59607843],
       [0.56078431, 0.5372549 , 0.6       ],
       [0.56862745, 0.54509804, 0.60392157],
       [0.57647059, 0.55294118, 0.61176471],
       [0.58039216, 0.56078431, 0.61568627],
       [0.58823529, 0.57254902, 0.61960784],
       [0.59607843, 0.58039216, 0.62352941],
       [0.60392157, 0.58823529, 0.63137255],
       [0.61176471, 0.6       , 0.63529412],
       [0.62352941, 0.60784314, 0.64313725],
       [0.63137255, 0.61960784, 0.64705882],
       [0.63921569, 0.62745098, 0.65490196],
       [0.64705882, 0.63921569, 0.6627451 ],
       [0.65882353, 0.65098039, 0.67058824],
       [0.66666667, 0.65882353, 0.67843137],
       [0.67843137, 0.67058824, 0.68627451],
       [0.68627451, 0.68235294, 0.69411765],
       [0.69803922, 0.69411765, 0.70196078],
       [0.70588235, 0.70588235, 0.71372549],
       [0.71764706, 0.71372549, 0.72156863],
       [0.72941176, 0.7254902 , 0.73333333],
       [0.74117647, 0.7372549 , 0.74117647],
       [0.75294118, 0.74901961, 0.75294118],
       [0.76470588, 0.76470588, 0.76470588],
       [0.77647059, 0.77647059, 0.77647059],
       [0.78823529, 0.78823529, 0.78823529],
       [0.79215686, 0.78823529, 0.78039216],
       [0.78431373, 0.77254902, 0.76078431],
       [0.77647059, 0.76078431, 0.74117647],
       [0.76862745, 0.74901961, 0.7254902 ],
       [0.76078431, 0.73333333, 0.70588235],
       [0.75294118, 0.72156863, 0.68627451],
       [0.74509804, 0.70980392, 0.67058824],
       [0.74117647, 0.69803922, 0.65490196],
       [0.73333333, 0.68627451, 0.63529412],
       [0.72941176, 0.6745098 , 0.61960784],
       [0.72156863, 0.66666667, 0.60392157],
       [0.71764706, 0.65490196, 0.58823529],
       [0.70980392, 0.64313725, 0.57254902],
       [0.70588235, 0.63137255, 0.55686275],
       [0.70196078, 0.62352941, 0.54509804],
       [0.69411765, 0.61176471, 0.52941176],
       [0.69019608, 0.60392157, 0.51372549],
       [0.68627451, 0.59215686, 0.50196078],
       [0.68235294, 0.58431373, 0.48627451],
       [0.67843137, 0.57647059, 0.4745098 ],
       [0.6745098 , 0.56470588, 0.4627451 ],
       [0.67058824, 0.55686275, 0.45098039],
       [0.66666667, 0.54901961, 0.43921569],
       [0.66666667, 0.54117647, 0.42745098],
       [0.6627451 , 0.53333333, 0.41568627],
       [0.65882353, 0.5254902 , 0.40392157],
       [0.65490196, 0.51764706, 0.39215686],
       [0.65490196, 0.50980392, 0.38039216],
       [0.65098039, 0.50196078, 0.36862745],
       [0.64705882, 0.49803922, 0.36078431],
       [0.64705882, 0.49019608, 0.34901961],
       [0.64313725, 0.48235294, 0.34117647],
       [0.64313725, 0.47843137, 0.32941176],
       [0.64313725, 0.47058824, 0.32156863],
       [0.63921569, 0.46666667, 0.31372549],
       [0.63921569, 0.45882353, 0.30196078],
       [0.63921569, 0.45490196, 0.29411765],
       [0.63529412, 0.45098039, 0.28627451],
       [0.63529412, 0.44313725, 0.27843137],
       [0.63529412, 0.43921569, 0.27058824],
       [0.63529412, 0.43529412, 0.2627451 ],
       [0.63529412, 0.43137255, 0.25490196],
       [0.63529412, 0.42745098, 0.24705882],
       [0.63529412, 0.42352941, 0.23921569],
       [0.63529412, 0.41960784, 0.23137255],
       [0.63529412, 0.41568627, 0.22745098],
       [0.63529412, 0.41176471, 0.21960784],
       [0.63529412, 0.40784314, 0.21176471],
       [0.63921569, 0.40392157, 0.20784314],
       [0.63921569, 0.40392157, 0.2       ],
       [0.63921569, 0.4       , 0.19607843],
       [0.63921569, 0.39607843, 0.18823529],
       [0.64313725, 0.39607843, 0.18431373],
       [0.64313725, 0.39607843, 0.17647059],
       [0.64705882, 0.39215686, 0.17254902],
       [0.64705882, 0.39215686, 0.16862745],
       [0.65098039, 0.38823529, 0.16078431],
       [0.65098039, 0.38823529, 0.15686275],
       [0.65490196, 0.38823529, 0.15294118],
       [0.65490196, 0.38823529, 0.14901961],
       [0.65882353, 0.38823529, 0.14117647],
       [0.6627451 , 0.38823529, 0.1372549 ],
       [0.66666667, 0.38823529, 0.13333333],
       [0.66666667, 0.38823529, 0.12941176],
       [0.67058824, 0.38823529, 0.1254902 ],
       [0.6745098 , 0.39215686, 0.12156863],
       [0.67843137, 0.39215686, 0.11764706],
       [0.68235294, 0.39215686, 0.11372549],
       [0.68627451, 0.39607843, 0.10980392],
       [0.69019608, 0.39607843, 0.10588235],
       [0.69411765, 0.4       , 0.10196078],
       [0.69803922, 0.4       , 0.09803922],
       [0.70196078, 0.40392157, 0.09411765],
       [0.70588235, 0.40784314, 0.09019608],
       [0.70980392, 0.41176471, 0.08627451],
       [0.71372549, 0.41568627, 0.08235294],
       [0.71764706, 0.41960784, 0.07843137],
       [0.7254902 , 0.42352941, 0.0745098 ],
       [0.72941176, 0.42745098, 0.07058824],
       [0.73333333, 0.43137255, 0.06666667],
       [0.7372549 , 0.43529412, 0.0627451 ],
       [0.74509804, 0.43921569, 0.05882353],
       [0.74901961, 0.44705882, 0.05882353],
       [0.75294118, 0.45098039, 0.05490196],
       [0.76078431, 0.45882353, 0.05098039],
       [0.76470588, 0.4627451 , 0.04705882],
       [0.77254902, 0.47058824, 0.04313725],
       [0.77647059, 0.47843137, 0.03921569],
       [0.78431373, 0.48627451, 0.03529412],
       [0.78823529, 0.49411765, 0.03137255],
       [0.79607843, 0.50196078, 0.02745098],
       [0.8       , 0.50980392, 0.02352941],
       [0.80784314, 0.51764706, 0.01960784],
       [0.81176471, 0.5254902 , 0.01568627],
       [0.81960784, 0.53333333, 0.01568627],
       [0.82352941, 0.54509804, 0.01176471],
       [0.83137255, 0.55294118, 0.00784314],
       [0.83921569, 0.56078431, 0.00392157],
       [0.84313725, 0.57254902, 0.00392157],
       [0.85098039, 0.58431373, 0.        ],
       [0.85490196, 0.59215686, 0.        ],
       [0.8627451 , 0.60392157, 0.        ],
       [0.86666667, 0.61568627, 0.        ],
       [0.8745098 , 0.62745098, 0.        ],
       [0.88235294, 0.63921569, 0.        ],
       [0.88627451, 0.65098039, 0.        ],
       [0.89411765, 0.6627451 , 0.        ],
       [0.89803922, 0.67843137, 0.        ],
       [0.90588235, 0.69019608, 0.        ],
       [0.91372549, 0.70196078, 0.        ],
       [0.91764706, 0.71764706, 0.        ],
       [0.9254902 , 0.73333333, 0.        ],
       [0.92941176, 0.74509804, 0.        ],
       [0.93333333, 0.76078431, 0.        ],
       [0.94117647, 0.77647059, 0.        ],
       [0.94509804, 0.79215686, 0.        ],
       [0.95294118, 0.80784314, 0.        ],
       [0.95686275, 0.82352941, 0.        ],
       [0.96078431, 0.83921569, 0.        ],
       [0.96862745, 0.85490196, 0.        ],
       [0.97254902, 0.87058824, 0.        ],
       [0.97647059, 0.89019608, 0.        ],
       [0.98039216, 0.90588235, 0.        ],
       [0.98431373, 0.9254902 , 0.        ],
       [0.98823529, 0.94509804, 0.        ],
       [0.99215686, 0.96078431, 0.        ],
       [0.99607843, 0.98039216, 0.        ],
       [1.        , 1.        , 0.        ]])

cmap_seismic = ListedColormap(seismic)


# Adapted from https://matplotlib.org/stable/tutorials/colors/colormaps.html
gradient = np.linspace(0, 1, 256)
gradient = np.vstack((gradient, gradient))

fig, ax = plt.subplots(nrows=1, figsize=(6, 1));
fig.subplots_adjust(top=0.5, bottom=0.15,
                    left=0.2, right=1);
ax.set_title('Seismic Colorbar', fontsize=14);


ax.imshow(gradient, aspect='auto', cmap=cmap_seismic);

# Turn off *all* ticks & spines, not just the ones with colormaps.
ax.set_axis_off();

Define Batlow Colorbar#
The Batlow colorbar was adapted from https://github.com/callumrollo/cmcrameri/blob/master/cmcrameri/cmaps/batlow.txt-
From https://www.fabiocrameri.ch/colourmaps/:
Fairly representing data - The colour gradients are perceptually uniform and ordered to represent data both fairly, without visual distortion, and intuitively
Universally readable - The colour combinations are readable both by colour-vision deficient and colour-blind people, and even when printed in black&white
Citable & reproducible - The colour maps and their diagnostics are permanently archived and versioned to enable upgrades and acknowledge developers and contributors
[6]:
batlow = np.array([[0.005193,0.098238,0.349842],
[0.009065,0.104487,0.350933],
[0.012963,0.110779,0.351992],
[0.016530,0.116913,0.353070],
[0.019936,0.122985,0.354120],
[0.023189,0.129035,0.355182],
[0.026291,0.135044,0.356210],
[0.029245,0.140964,0.357239],
[0.032053,0.146774,0.358239],
[0.034853,0.152558,0.359233],
[0.037449,0.158313,0.360216],
[0.039845,0.163978,0.361187],
[0.042104,0.169557,0.362151],
[0.044069,0.175053,0.363084],
[0.045905,0.180460,0.364007],
[0.047665,0.185844,0.364915],
[0.049378,0.191076,0.365810],
[0.050795,0.196274,0.366684],
[0.052164,0.201323,0.367524],
[0.053471,0.206357,0.368370],
[0.054721,0.211234,0.369184],
[0.055928,0.216046,0.369974],
[0.057033,0.220754,0.370750],
[0.058032,0.225340,0.371509],
[0.059164,0.229842,0.372252],
[0.060167,0.234299,0.372978],
[0.061052,0.238625,0.373691],
[0.062060,0.242888,0.374386],
[0.063071,0.247085,0.375050],
[0.063982,0.251213,0.375709],
[0.064936,0.255264,0.376362],
[0.065903,0.259257,0.376987],
[0.066899,0.263188,0.377594],
[0.067921,0.267056,0.378191],
[0.069002,0.270922,0.378774],
[0.070001,0.274713,0.379342],
[0.071115,0.278497,0.379895],
[0.072192,0.282249,0.380434],
[0.073440,0.285942,0.380957],
[0.074595,0.289653,0.381452],
[0.075833,0.293321,0.381922],
[0.077136,0.296996,0.382376],
[0.078517,0.300622,0.382814],
[0.079984,0.304252,0.383224],
[0.081553,0.307858,0.383598],
[0.083082,0.311461,0.383936],
[0.084778,0.315043,0.384240],
[0.086503,0.318615,0.384506],
[0.088353,0.322167,0.384731],
[0.090281,0.325685,0.384910],
[0.092304,0.329220,0.385040],
[0.094462,0.332712,0.385116],
[0.096618,0.336161,0.385134],
[0.099015,0.339621,0.385090],
[0.101481,0.343036,0.384981],
[0.104078,0.346410,0.384801],
[0.106842,0.349774,0.384548],
[0.109695,0.353098,0.384217],
[0.112655,0.356391,0.383807],
[0.115748,0.359638,0.383310],
[0.118992,0.362849,0.382713],
[0.122320,0.366030,0.382026],
[0.125889,0.369160,0.381259],
[0.129519,0.372238,0.380378],
[0.133298,0.375282,0.379395],
[0.137212,0.378282,0.378315],
[0.141260,0.381240,0.377135],
[0.145432,0.384130,0.375840],
[0.149706,0.386975,0.374449],
[0.154073,0.389777,0.372934],
[0.158620,0.392531,0.371320],
[0.163246,0.395237,0.369609],
[0.167952,0.397889,0.367784],
[0.172788,0.400496,0.365867],
[0.177752,0.403041,0.363833],
[0.182732,0.405551,0.361714],
[0.187886,0.408003,0.359484],
[0.193050,0.410427,0.357177],
[0.198310,0.412798,0.354767],
[0.203676,0.415116,0.352253],
[0.209075,0.417412,0.349677],
[0.214555,0.419661,0.347019],
[0.220112,0.421864,0.344261],
[0.225707,0.424049,0.341459],
[0.231362,0.426197,0.338572],
[0.237075,0.428325,0.335634],
[0.242795,0.430418,0.332635],
[0.248617,0.432493,0.329571],
[0.254452,0.434529,0.326434],
[0.260320,0.436556,0.323285],
[0.266241,0.438555,0.320085],
[0.272168,0.440541,0.316831],
[0.278171,0.442524,0.313552],
[0.284175,0.444484,0.310243],
[0.290214,0.446420,0.306889],
[0.296294,0.448357,0.303509],
[0.302379,0.450282,0.300122],
[0.308517,0.452205,0.296721],
[0.314648,0.454107,0.293279],
[0.320834,0.456006,0.289841],
[0.327007,0.457900,0.286377],
[0.333235,0.459794,0.282937],
[0.339469,0.461685,0.279468],
[0.345703,0.463563,0.275998],
[0.351976,0.465440,0.272492],
[0.358277,0.467331,0.269037],
[0.364589,0.469213,0.265543],
[0.370922,0.471085,0.262064],
[0.377291,0.472952,0.258588],
[0.383675,0.474842,0.255131],
[0.390070,0.476711,0.251665],
[0.396505,0.478587,0.248212],
[0.402968,0.480466,0.244731],
[0.409455,0.482351,0.241314],
[0.415967,0.484225,0.237895],
[0.422507,0.486113,0.234493],
[0.429094,0.488011,0.231096],
[0.435714,0.489890,0.227728],
[0.442365,0.491795,0.224354],
[0.449052,0.493684,0.221074],
[0.455774,0.495585,0.217774],
[0.462539,0.497497,0.214518],
[0.469368,0.499393,0.211318],
[0.476221,0.501314,0.208148],
[0.483123,0.503216,0.205037],
[0.490081,0.505137,0.201976],
[0.497089,0.507058,0.198994],
[0.504153,0.508984,0.196118],
[0.511253,0.510898,0.193296],
[0.518425,0.512822,0.190566],
[0.525637,0.514746,0.187990],
[0.532907,0.516662,0.185497],
[0.540225,0.518584,0.183099],
[0.547599,0.520486,0.180884],
[0.555024,0.522391,0.178854],
[0.562506,0.524293,0.176964],
[0.570016,0.526186,0.175273],
[0.577582,0.528058,0.173775],
[0.585199,0.529927,0.172493],
[0.592846,0.531777,0.171449],
[0.600520,0.533605,0.170648],
[0.608240,0.535423,0.170104],
[0.615972,0.537231,0.169826],
[0.623739,0.539002,0.169814],
[0.631513,0.540752,0.170075],
[0.639301,0.542484,0.170622],
[0.647098,0.544183,0.171465],
[0.654889,0.545863,0.172603],
[0.662691,0.547503,0.174044],
[0.670477,0.549127,0.175747],
[0.678244,0.550712,0.177803],
[0.685995,0.552274,0.180056],
[0.693720,0.553797,0.182610],
[0.701421,0.555294,0.185478],
[0.709098,0.556772,0.188546],
[0.716731,0.558205,0.191851],
[0.724322,0.559628,0.195408],
[0.731878,0.561011,0.199174],
[0.739393,0.562386,0.203179],
[0.746850,0.563725,0.207375],
[0.754268,0.565033,0.211761],
[0.761629,0.566344,0.216322],
[0.768942,0.567630,0.221045],
[0.776208,0.568899,0.225930],
[0.783416,0.570162,0.230962],
[0.790568,0.571421,0.236160],
[0.797665,0.572682,0.241490],
[0.804709,0.573928,0.246955],
[0.811692,0.575187,0.252572],
[0.818610,0.576462,0.258303],
[0.825472,0.577725,0.264197],
[0.832272,0.579026,0.270211],
[0.838999,0.580339,0.276353],
[0.845657,0.581672,0.282631],
[0.852247,0.583037,0.289036],
[0.858747,0.584440,0.295572],
[0.865168,0.585882,0.302255],
[0.871505,0.587352,0.309112],
[0.877741,0.588873,0.316081],
[0.883878,0.590450,0.323195],
[0.889900,0.592087,0.330454],
[0.895809,0.593765,0.337865],
[0.901590,0.595507,0.345429],
[0.907242,0.597319,0.353142],
[0.912746,0.599191,0.360986],
[0.918103,0.601126,0.368999],
[0.923300,0.603137,0.377139],
[0.928323,0.605212,0.385404],
[0.933176,0.607369,0.393817],
[0.937850,0.609582,0.402345],
[0.942332,0.611867,0.411006],
[0.946612,0.614218,0.419767],
[0.950697,0.616649,0.428624],
[0.954574,0.619137,0.437582],
[0.958244,0.621671,0.446604],
[0.961696,0.624282,0.455702],
[0.964943,0.626934,0.464860],
[0.967983,0.629639,0.474057],
[0.970804,0.632394,0.483290],
[0.973424,0.635183,0.492547],
[0.975835,0.638012,0.501826],
[0.978052,0.640868,0.511090],
[0.980079,0.643752,0.520350],
[0.981918,0.646664,0.529602],
[0.983574,0.649590,0.538819],
[0.985066,0.652522,0.547998],
[0.986392,0.655470,0.557142],
[0.987567,0.658422,0.566226],
[0.988596,0.661378,0.575265],
[0.989496,0.664329,0.584246],
[0.990268,0.667280,0.593174],
[0.990926,0.670230,0.602031],
[0.991479,0.673165,0.610835],
[0.991935,0.676091,0.619575],
[0.992305,0.679007,0.628251],
[0.992595,0.681914,0.636869],
[0.992813,0.684815,0.645423],
[0.992967,0.687705,0.653934],
[0.993064,0.690579,0.662398],
[0.993111,0.693451,0.670810],
[0.993112,0.696314,0.679177],
[0.993074,0.699161,0.687519],
[0.993002,0.702006,0.695831],
[0.992900,0.704852,0.704114],
[0.992771,0.707689,0.712380],
[0.992619,0.710530,0.720639],
[0.992447,0.713366,0.728892],
[0.992258,0.716210,0.737146],
[0.992054,0.719049,0.745403],
[0.991837,0.721893,0.753673],
[0.991607,0.724754,0.761959],
[0.991367,0.727614,0.770270],
[0.991116,0.730489,0.778606],
[0.990855,0.733373,0.786976],
[0.990586,0.736265,0.795371],
[0.990307,0.739184,0.803810],
[0.990018,0.742102,0.812285],
[0.989720,0.745039,0.820804],
[0.989411,0.747997,0.829372],
[0.989089,0.750968,0.837979],
[0.988754,0.753949,0.846627],
[0.988406,0.756949,0.855332],
[0.988046,0.759964,0.864078],
[0.987672,0.762996,0.872864],
[0.987280,0.766047,0.881699],
[0.986868,0.769105,0.890573],
[0.986435,0.772184,0.899493],
[0.985980,0.775272,0.908448],
[0.985503,0.778378,0.917444],
[0.985002,0.781495,0.926468],
[0.984473,0.784624,0.935531],
[0.983913,0.787757,0.944626],
[0.983322,0.790905,0.953748],
[0.982703,0.794068,0.962895],
[0.982048,0.797228,0.972070],
[0.981354,0.800406,0.981267]])

cmap_batlow = ListedColormap(batlow)


# Adapted from https://matplotlib.org/stable/tutorials/colors/colormaps.html
gradient = np.linspace(0, 1, 256)
gradient = np.vstack((gradient, gradient))

fig, ax = plt.subplots(nrows=1, figsize=(6, 1));
fig.subplots_adjust(top=0.5, bottom=0.15,
                    left=0.2, right=1);
ax.set_title('Batlow Colorbar', fontsize=14);


ax.imshow(gradient, aspect='auto', cmap=cmap_batlow);

# Turn off *all* ticks & spines, not just the ones with colormaps.
ax.set_axis_off();

Selecting and reshaping the seismic data#
[7]:
cdp = 100

# Defining the number of rows
rows = int(len(df_scan29.loc[cdp]))

# Cropping the data
df_scan29_selection = df_scan29.loc[12000:]

# Defining the number of columns
columns = int(len(df_scan29_selection)/rows)

# Extract values from DataFrame
df_scan29_data = df_scan29_selection['data'].values

# Reshape data
df_scan29_data_reshaped = df_scan29_data.reshape(columns, rows)

# Selecting data only up to 2.5 s TWT
depth_twt = 2500
indices_twt = int((rows-1)/(df_scan29.loc[cdp].index.max()-df_scan29.loc[cdp].index.min())*depth_twt+1)

df_scan29_data_reshaped_selected = df_scan29_data_reshaped[:,:indices_twt]
df_scan29_data_reshaped_selected
[7]:
array([[ 0.        , -0.6604564 , -0.5132353 , ...,  0.38492066,
         0.18723893, -0.3822595 ],
       [ 0.        , -0.6229209 , -0.5288663 , ...,  0.35308176,
         0.14418834, -0.46200967],
       [ 0.        , -0.58638173, -0.5448488 , ...,  0.3399232 ,
         0.09482116, -0.56471187],
       ...,
       [ 0.        ,  1.5639963 ,  1.7435122 , ...,  1.85919   ,
         1.66117   ,  0.4377218 ],
       [ 0.        ,  1.715455  ,  1.7838211 , ...,  1.9031734 ,
         1.6262188 ,  0.33231133],
       [ 0.        ,  1.8398867 ,  1.790576  , ...,  1.9389725 ,
         1.5917187 ,  0.23935503]], dtype=float32)
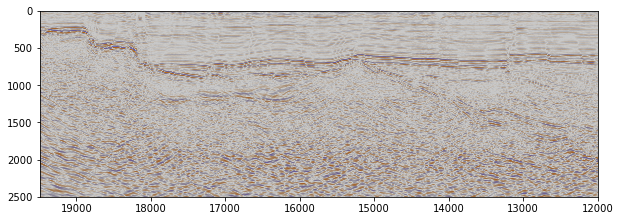
Plotting Seismic Sections#
[8]:
# Defining the extent
df_scan29_reset_index = df_scan29_selection.reset_index()
minx = df_scan29_reset_index['cdp'].min()
maxx = df_scan29_reset_index['cdp'].max()

fig, ax = plt.subplots(1, figsize=(10,10))
plt.imshow(np.fliplr(df_scan29_data_reshaped_selected.T),
           cmap=cmap_seismic,
           vmin=-7,
           vmax=7,
           extent=[maxx,
                   minx,
                   depth_twt,
                   df_scan29.loc[cdp].index.min()])
[8]:
<matplotlib.image.AxesImage at 0x27108431e50>
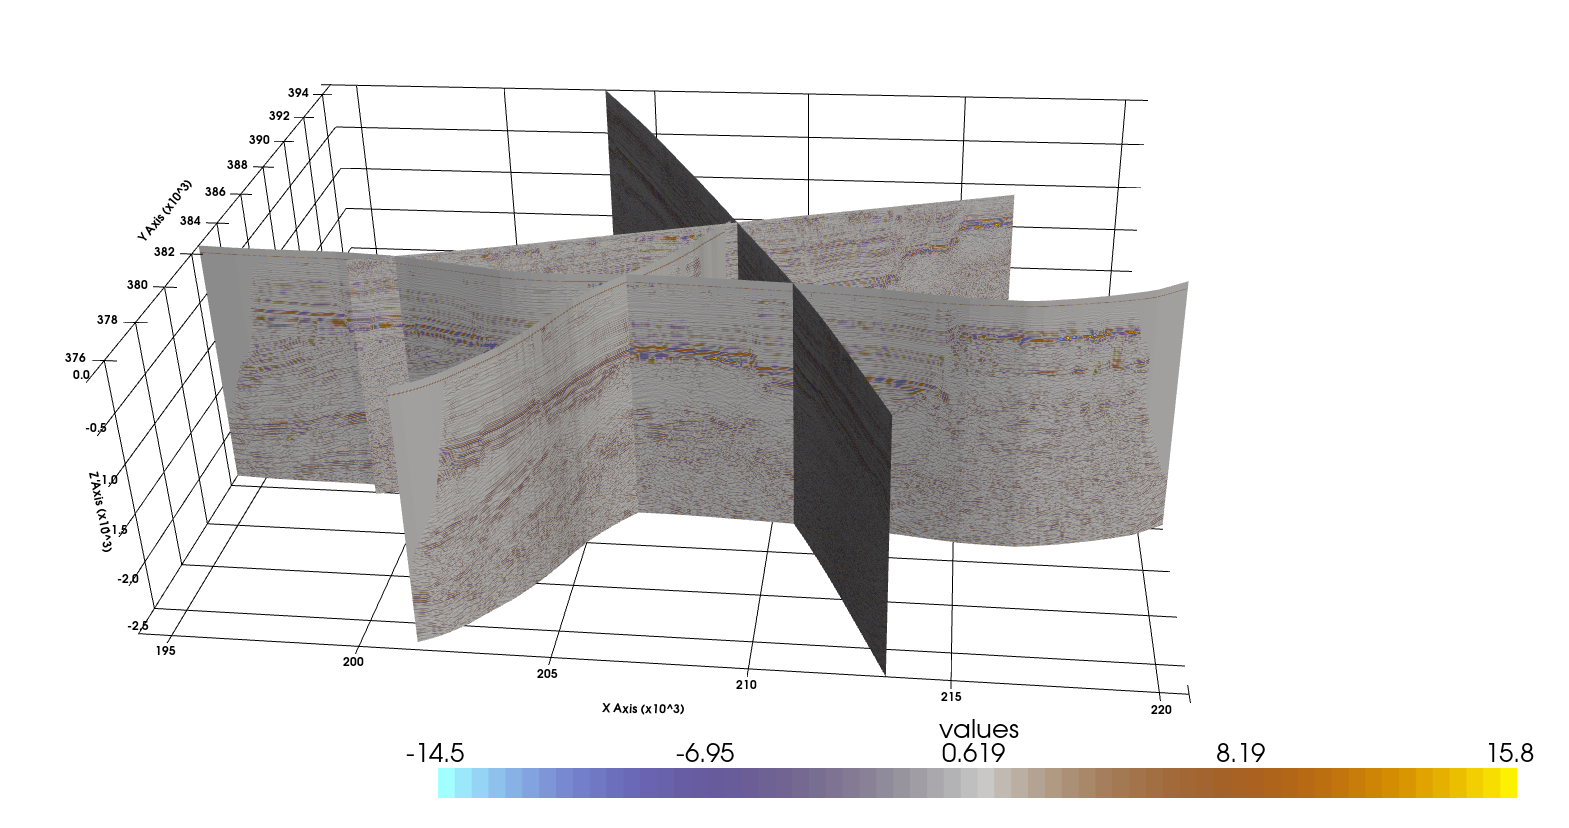
Draping 2D Surface from Line#
Drape the 2D seismic data over a mesh along the seismic line. This workflow is adapted from the PyVista Tutorial at https://docs.pyvista.org/examples/00-load/create-surface-draped.html#sphx-glr-examples-00-load-create-surface-draped-py.
[9]:
ntraces, nsamples = df_scan29_data_reshaped_selected.shape
print(nsamples, ntraces)
1251 7493
[10]:
sample_spacing = 2 # ms - milliseconds
sample_spacing
[10]:
2
[11]:
df_scan29_selection[['cdp_x', 'cdp_y']]
[11]:
| cdp_x | cdp_y | ||
|---|---|---|---|
| cdp | twt | ||
| 12000 | 0.0 | 198476.09375 | 381918.71875 |
| 2.0 | 198476.09375 | 381918.71875 | |
| 4.0 | 198476.09375 | 381918.71875 | |
| 6.0 | 198476.09375 | 381918.71875 | |
| 8.0 | 198476.09375 | 381918.71875 | |
| ... | ... | ... | ... |
| 19492 | 9992.0 | 216394.50000 | 387366.18750 |
| 9994.0 | 216394.50000 | 387366.18750 | |
| 9996.0 | 216394.50000 | 387366.18750 | |
| 9998.0 | 216394.50000 | 387366.18750 | |
| 10000.0 | 216394.50000 | 387366.18750 |
37472493 rows × 2 columns
[12]:
cdps =  np.unique(df_scan29_selection[['cdp_x', 'cdp_y']].values,axis=0)
print(len(cdps))
cdps
7493
[12]:
array([[198476.1 , 381918.72],
       [198478.5 , 381919.28],
       [198480.89, 381920.  ],
       ...,
       [216389.69, 387364.72],
       [216392.1 , 387365.5 ],
       [216394.5 , 387366.2 ]], dtype=float32)
[13]:
path = np.c_[cdps, np.zeros(len(cdps))]
path
[13]:
array([[198476.09375 , 381918.71875 ,      0.      ],
       [198478.5     , 381919.28125 ,      0.      ],
       [198480.890625, 381920.      ,      0.      ],
       ...,
       [216389.6875  , 387364.71875 ,      0.      ],
       [216392.09375 , 387365.5     ,      0.      ],
       [216394.5     , 387366.1875  ,      0.      ]])
[14]:
points = np.repeat(path, nsamples, axis=0)
points
[14]:
array([[198476.09375, 381918.71875,      0.     ],
       [198476.09375, 381918.71875,      0.     ],
       [198476.09375, 381918.71875,      0.     ],
       ...,
       [216394.5    , 387366.1875 ,      0.     ],
       [216394.5    , 387366.1875 ,      0.     ],
       [216394.5    , 387366.1875 ,      0.     ]])
[15]:
# repeat the Z locations across
tp = np.arange(0, sample_spacing * nsamples, sample_spacing)
tp = path[:, 2][:, None] - tp
points[:, -1] = tp.ravel()
Creating Structured Grid#
[16]:
grid = pv.StructuredGrid()
grid.points = points
grid.dimensions = nsamples, ntraces, 1

# Add the data array - note the ordering!
grid["values"] = df_scan29_data_reshaped_selected.ravel(order="C")
grid
[16]:
| Header | Data Arrays | ||||||||||||||||||||||||||||
|---|---|---|---|---|---|---|---|---|---|---|---|---|---|---|---|---|---|---|---|---|---|---|---|---|---|---|---|---|---|
|
|
Load Remaining Meshes#
[17]:
cal01 = pv.read(file_path+'Californie_01.vtk')
cal01
[17]:
| Header | Data Arrays | ||||||||||||||||||||||||||||
|---|---|---|---|---|---|---|---|---|---|---|---|---|---|---|---|---|---|---|---|---|---|---|---|---|---|---|---|---|---|
|
|
[18]:
cal02 = pv.read(file_path+'Californie_02.vtk')
cal02
[18]:
| Header | Data Arrays | ||||||||||||||||||||||||||||
|---|---|---|---|---|---|---|---|---|---|---|---|---|---|---|---|---|---|---|---|---|---|---|---|---|---|---|---|---|---|
|
|
[20]:
scan20 = pv.read(file_path+'Scan_Line_20.vtk')
scan20
[20]:
| Header | Data Arrays | ||||||||||||||||||||||||||||
|---|---|---|---|---|---|---|---|---|---|---|---|---|---|---|---|---|---|---|---|---|---|---|---|---|---|---|---|---|---|
|
|
[21]:
base_tertiary = pv.read(file_path + 'Base_Tertiary.vtk')
base_tertiary
[21]:
| Header | Data Arrays | ||||||||||||||||||||||||||||
|---|---|---|---|---|---|---|---|---|---|---|---|---|---|---|---|---|---|---|---|---|---|---|---|---|---|---|---|---|---|
|
|
[23]:
outline_nrw_clipped = pv.read(file_path + 'Outline_NRW_Mesh.vtk')
outline_nrw_clipped
[23]:
| Header | Data Arrays | ||||||||||||||||||||||||||
|---|---|---|---|---|---|---|---|---|---|---|---|---|---|---|---|---|---|---|---|---|---|---|---|---|---|---|---|
|
|
[25]:
top_dinant = pv.read(file_path + 'Top_Dinant.vtk')
top_dinant
[25]:
| Header | Data Arrays | ||||||||||||||||||||||||||||
|---|---|---|---|---|---|---|---|---|---|---|---|---|---|---|---|---|---|---|---|---|---|---|---|---|---|---|---|---|---|
|
|
Clipping meshes and calculating contours#
[27]:
base_tertiary_clipped = base_tertiary.clip_box([190000, 225000, 370000, 400000, -2500.0, 100.0], invert=False)
top_dinant_clipped = top_dinant.clip_box([190000, 225000, 370000, 400000, -2500.0, 100.0], invert=False)
[28]:
base_tertiary_clipped_contours = base_tertiary_clipped.contour(np.linspace(-850, -500, 50))
base_tertiary_clipped_contours
[28]:
| Header | Data Arrays | ||||||||||||||||||||||||||
|---|---|---|---|---|---|---|---|---|---|---|---|---|---|---|---|---|---|---|---|---|---|---|---|---|---|---|---|
|
|
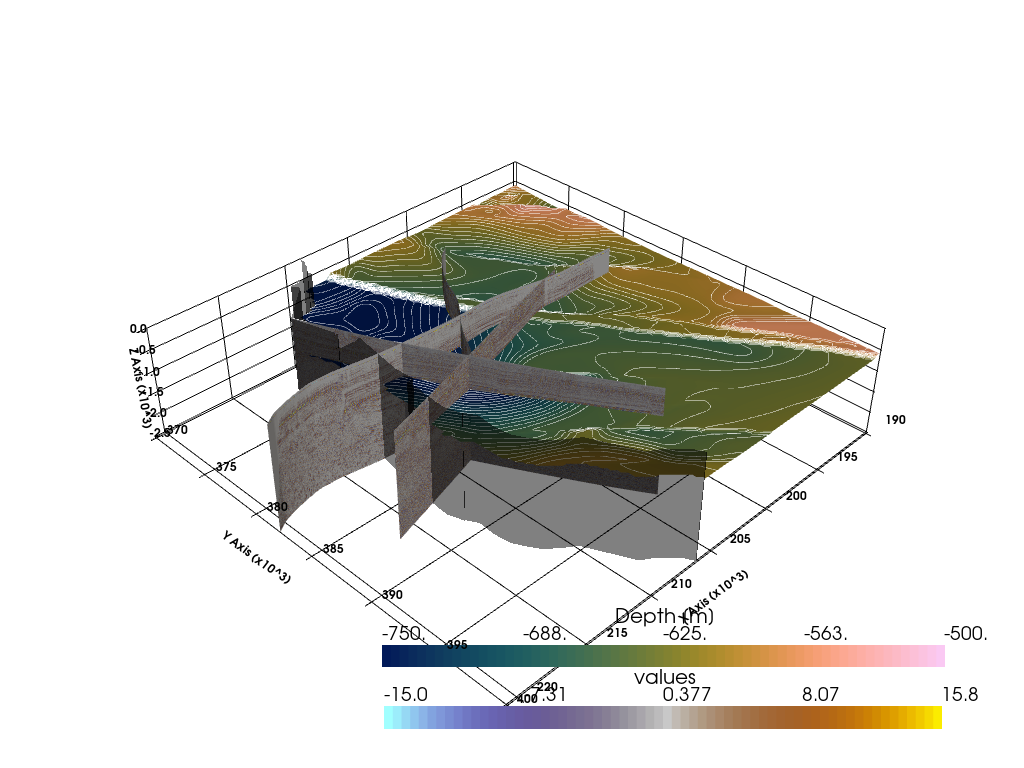
Plotting Seismic Data and Surfaces#
[31]:
import pyvista as pv

sargs = dict(color='black')

p = pv.Plotter(notebook=True)

p.add_mesh(grid, cmap=cmap_seismic,scalar_bar_args=sargs, clim=[-15,15])
p.add_mesh(cal01, cmap=cmap_seismic)
p.add_mesh(cal02, cmap=cmap_seismic)
p.add_mesh(scan20, cmap=cmap_seismic)
p.add_mesh(base_tertiary_clipped, cmap=cmap_batlow,scalar_bar_args=sargs, clim=[-750,-500])
p.add_mesh(base_tertiary_clipped_contours, color='white')
# p.add_mesh(top_dinant_clipped, cmap='viridis')
p.add_mesh(outline_nrw_clipped, color='black', opacity=0.5)
p.show_grid(color='black')
p.set_background(color='white')
p.set_scale(1,1,3)

p.show()