17 Plotting Orientations with mplstereonet
Contents
17 Plotting Orientations with mplstereonet#
Orientation measurements stored as GeoDataFrame can easily be plotted using GemGIS and mplstereonet.
Set File Paths and download Tutorial Data#
If you downloaded the latest GemGIS version from the Github repository, append the path so that the package can be imported successfully. Otherwise, it is recommended to install GemGIS via pip install gemgis and import GemGIS using import gemgis as gg. In addition, the file path to the folder where the data is being stored is set. The tutorial data is downloaded using Pooch (https://www.fatiando.org/pooch/latest/index.html) and stored in the specified folder. Use
pip install pooch if Pooch is not installed on your system yet.
[1]:
import gemgis as gg

file_path ='data/17_plotting_orientations_with_mplstereonet/'
C:\Users\ale93371\Anaconda3\envs\gemgis\lib\site-packages\gemgis\gemgis.py:27: UserWarning: Shapely 2.0 is installed, but because PyGEOS is also installed, GeoPandas will still use PyGEOS by default for now. To force to use and test Shapely 2.0, you have to set the environment variable USE_PYGEOS=0. You can do this before starting the Python process, or in your code before importing geopandas:

import os
os.environ['USE_PYGEOS'] = '0'
import geopandas

In a future release, GeoPandas will switch to using Shapely by default. If you are using PyGEOS directly (calling PyGEOS functions on geometries from GeoPandas), this will then stop working and you are encouraged to migrate from PyGEOS to Shapely 2.0 (https://shapely.readthedocs.io/en/latest/migration_pygeos.html).
  import geopandas as gpd
[2]:
gg.download_gemgis_data.download_tutorial_data(filename="17_plotting_orientations_with_mplstereonet.zip", dirpath=file_path)
Loading the Data#
[3]:
import geopandas as gpd

orientations = gpd.read_file(file_path + 'orientations.shp')
orientations
[3]:
| id | formation | dip | azimuth | geometry | |
|---|---|---|---|---|---|
| 0 | None | Sand | 25.00 | 310 | POINT (49.24855 1033.89335) |
| 1 | None | Sand | 30.00 | 315 | POINT (355.21200 947.55713) |
| 2 | None | Sand | 15.00 | 330 | POINT (720.24760 880.91163) |
| 3 | None | Clay | 10.00 | 135 | POINT (526.36977 611.30027) |
| 4 | None | Clay | 25.00 | 140 | POINT (497.59103 876.36762) |
| 5 | None | Clay | 35.00 | 50 | POINT (394.59343 481.03860) |
Plotting the data#
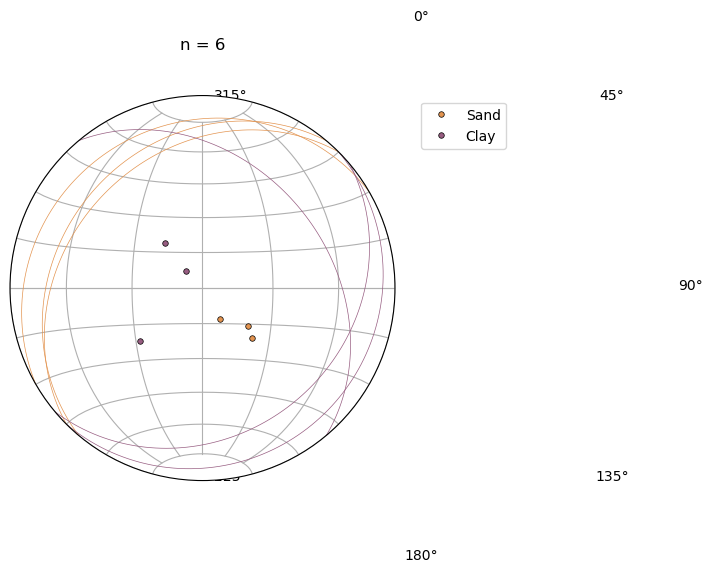
The data can be plotted using the GemGIS function plot_orientations and the underlying mplstereonet functions.
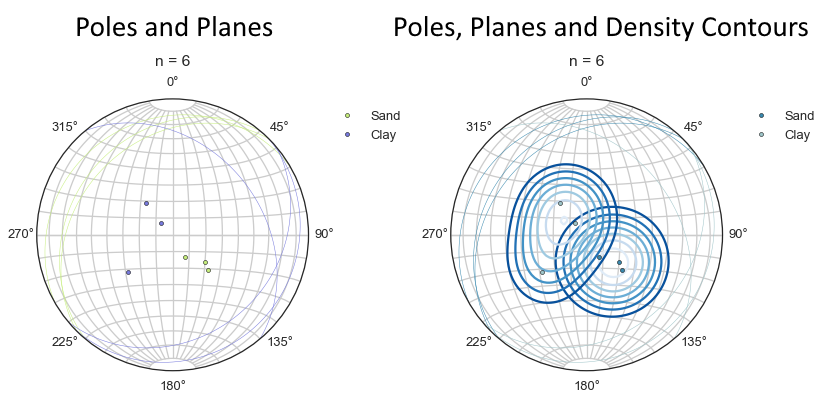
In the plot below, the poles and great circles are plotted.
[4]:
gg.visualization.plot_orientations(gdf=orientations,
                                   show_planes=True,
                                   show_density_contours=False,
                                   show_density_contourf=False,
                                   )
In addition, the density contours can be plotted. The method for calculating the density contours can be changed.
[5]:
gg.visualization.plot_orientations(gdf=orientations,
                                   show_planes=True,
                                   show_density_contours=True,
                                   show_density_contourf=False,
                                   )
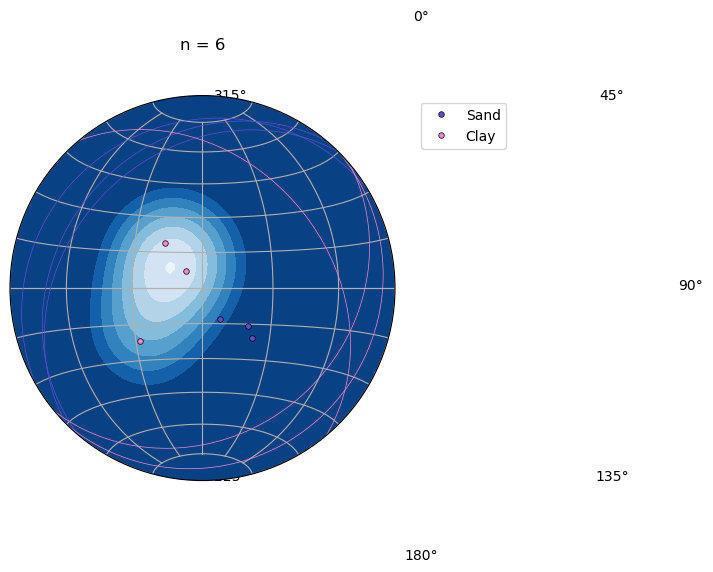
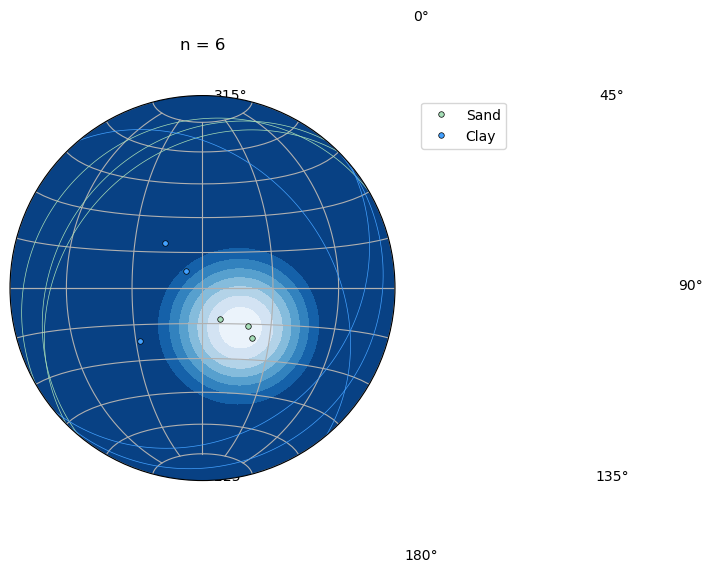
The filled density contours can be plotted for one formation by providing a formation name.
[6]:
gg.visualization.plot_orientations(gdf=orientations,
                                   show_planes=True,
                                   show_density_contours=False,
                                   show_density_contourf=True,
                                   formation='Sand'
                                   )
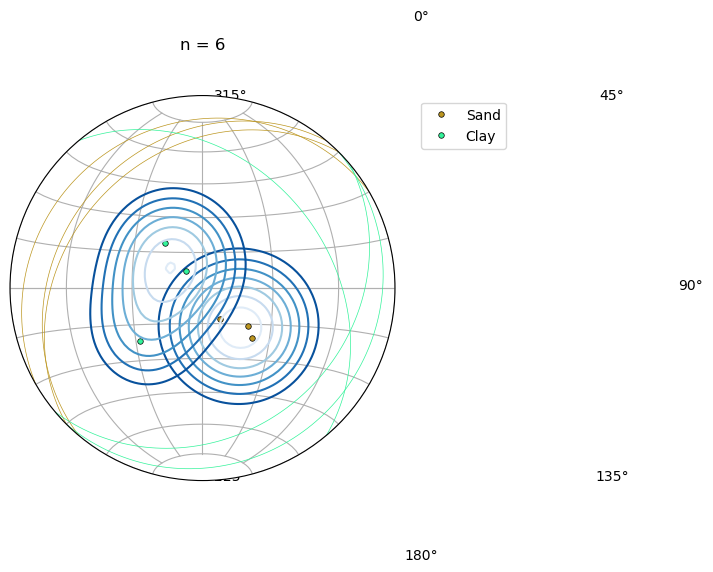
[7]:
gg.visualization.plot_orientations(gdf=orientations,
                                   show_planes=True,
                                   show_density_contours=False,
                                   show_density_contourf=True,
                                   formation='Clay'
                                   )