
06 Sampling from Rasters
Contents
06 Sampling from Rasters#
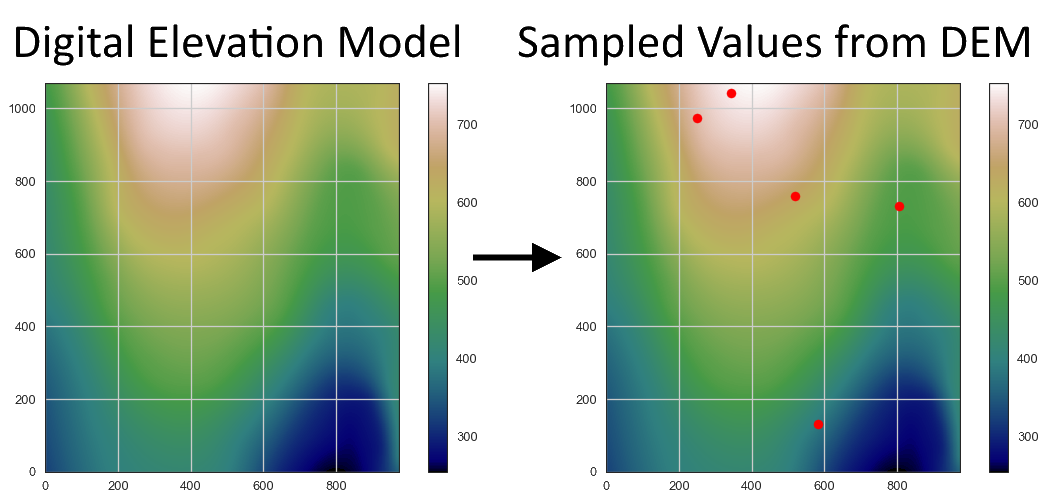
It may be important for some tasks to sample values of a raster at a certain point, e.g. an orientation measurement. The functionality to sample from an array or rasterio object directly or random sampling has been implemented in GemGIS and will be introduced here.
Set File Paths and download Tutorial Data#
If you downloaded the latest GemGIS version from the Github repository, append the path so that the package can be imported successfully. Otherwise, it is recommended to install GemGIS via pip install gemgis and import GemGIS using import gemgis as gg. In addition, the file path to the folder where the data is being stored is set. The tutorial data is downloaded using Pooch (https://www.fatiando.org/pooch/latest/index.html) and stored in the specified folder. Use
pip install pooch if Pooch is not installed on your system yet.
[1]:
import gemgis as gg

file_path ='data/06_sampling_from_rasters/'
[2]:
gg.download_gemgis_data.download_tutorial_data(filename="06_sampling_from_rasters.zip", dirpath=file_path)
Downloading file '06_sampling_from_rasters.zip' from 'https://rwth-aachen.sciebo.de/s/AfXRsZywYDbUF34/download?path=%2F06_sampling_from_rasters.zip' to 'C:\Users\ale93371\Documents\gemgis\docs\getting_started\tutorial\data\06_sampling_from_rasters'.
Loading the raster#
[3]:
import rasterio
import numpy as np

raster = rasterio.open(file_path + 'raster.tif')
Plotting the raster#
[4]:
import matplotlib.pyplot as plt

im = plt.imshow(raster.read(1), cmap='gist_earth',extent = [0, 972, 0, 1069])
plt.grid()
plt.colorbar(im)
[4]:
<matplotlib.colorbar.Colorbar at 0x179b6974100>

Sampling from Array#
The function gg.raster.sample_from_array(..) will be used to sample a single point or given lists/arrays of coordinates from an array.
Sampling from one given point.
[5]:
sample = gg.raster.sample_from_array(array = raster.read(1),
                                     extent = [0, 972, 0, 1069],
                                     point_x = 500,
                                     point_y = 500)

sample
[5]:
562.0227
Sampling from given lists of x and y coordinates.
[6]:
point_x = [100, 200, 300, 400 ,500]
point_y = [100, 200, 300, 400 ,500]

sample = gg.raster.sample_from_array(array = raster.read(1),
                                     extent = [0, 972, 0, 1069],
                                     point_x = point_x,
                                     point_y = point_y)

sample
[6]:
array([378.79877, 435.21704, 505.29126, 541.74146, 562.0227 ],
      dtype=float32)
Sampling from given arrays of x and y coordinates.
[7]:
point_x = np.array([100, 200, 300, 400 ,500.])
point_y = np.array([100, 200, 300, 400 ,500.])

sample = gg.raster.sample_from_array(array = raster.read(1),
                                     extent = [0, 972, 0, 1069],
                                     point_x = point_x,
                                     point_y = point_y)

sample
[7]:
array([378.79877, 435.21704, 505.29126, 541.74146, 562.0227 ],
      dtype=float32)
Sampling from Raster#
The function gg.raster.sample_from_raster(..) will be used to sample a single point or given lists/arrays of coordinates from raster.
Sampling from one given point.
[8]:
sample = gg.raster.sample_from_rasterio(raster = raster,
                                        point_x = 500,
                                        point_y = 500)

sample
[8]:
561.646728515625
Sampling from given lists of x and y coordinates.
[9]:
point_x = [100, 200, 300, 400 ,500]
point_y = [100, 200, 300, 400 ,500]

sample = gg.raster.sample_from_rasterio(raster = raster,
                                        point_x = point_x,
                                        point_y = point_y)

sample
[9]:
[376.72430419921875,
 435.217041015625,
 505.291259765625,
 540.6767578125,
 561.646728515625]
Sampling from given arrays of x and y coordinates.
[10]:
point_x = np.array([100, 200, 300, 400 ,500.])
point_y = np.array([100, 200, 300, 400 ,500.])

sample = gg.raster.sample_from_rasterio(raster = raster,
                                        point_x = point_x,
                                        point_y = point_y)

sample
[10]:
[376.72430419921875,
 435.217041015625,
 505.291259765625,
 540.6767578125,
 561.646728515625]
Sample Randomly from Raster#
The function gg.raster.sample_randomly(..) will be used to sample one or multiple points from an array or a raster.
Sample one point randomly from raster.
[11]:
sample = gg.raster.sample_randomly(raster=raster,
                                   n=1)

sample
[11]:
(559.26953125, [315.92081696676496, 479.1266134083539])
Sample multiple points randomly from raster.
[12]:
sample = gg.raster.sample_randomly(raster=raster,
                                   n=5)

sample
[12]:
([349.976806640625,
  593.2823486328125,
  469.182861328125,
  517.493896484375,
  457.33819580078125],
 [array([656.19476672, 428.41935331, 398.478624  , 419.74758082,
         117.59572753]),
  array([148.35611075, 563.45782055, 165.23874243, 307.06250898,
         453.00801777])])
Sample Randomly from Array#
Sample one point randomly from array.
[13]:
sample = gg.raster.sample_randomly(raster=raster.read(1),
                                   n=1,
                                   extent=[0, 972, 0, 1069])

sample
[13]:
(410.9246826171875, [231.80451313385362, 47.36589009664959])
Sample multiple points randomly from array.
[14]:
sample = gg.raster.sample_randomly(raster=raster.read(1),
                                   n=5,
                                   extent=[0, 972, 0, 1069])

sample
[14]:
([292.591064453125,
  608.958740234375,
  604.081298828125,
  482.37969970703125,
  617.5330810546875],
 [array([758.6160817 , 617.25201554, 479.26358106,  60.94460541,
         489.87045745]),
  array([128.41568426, 788.7398796 , 644.85742373, 799.84713491,
         692.40925628])])
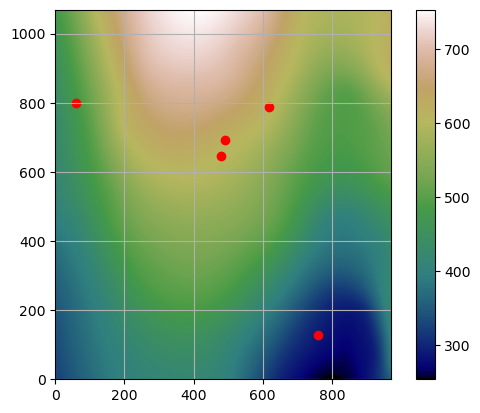
Plotting the points on the raster#
[15]:
import matplotlib.pyplot as plt

im = plt.imshow(raster.read(1), cmap='gist_earth',extent = [0, 972, 0, 1069])
plt.scatter(sample[1][0], sample[1][1], color='red')
plt.grid()
plt.colorbar(im)
[15]:
<matplotlib.colorbar.Colorbar at 0x179b7be5f60>
Sampling slope and aspect values#
In a same way, slope and aspect values can be sampled from a raster when using calculate_slope(..) and calculate_hillshades(..).