21 Working with Web Coverage Services
Contents
21 Working with Web Coverage Services#
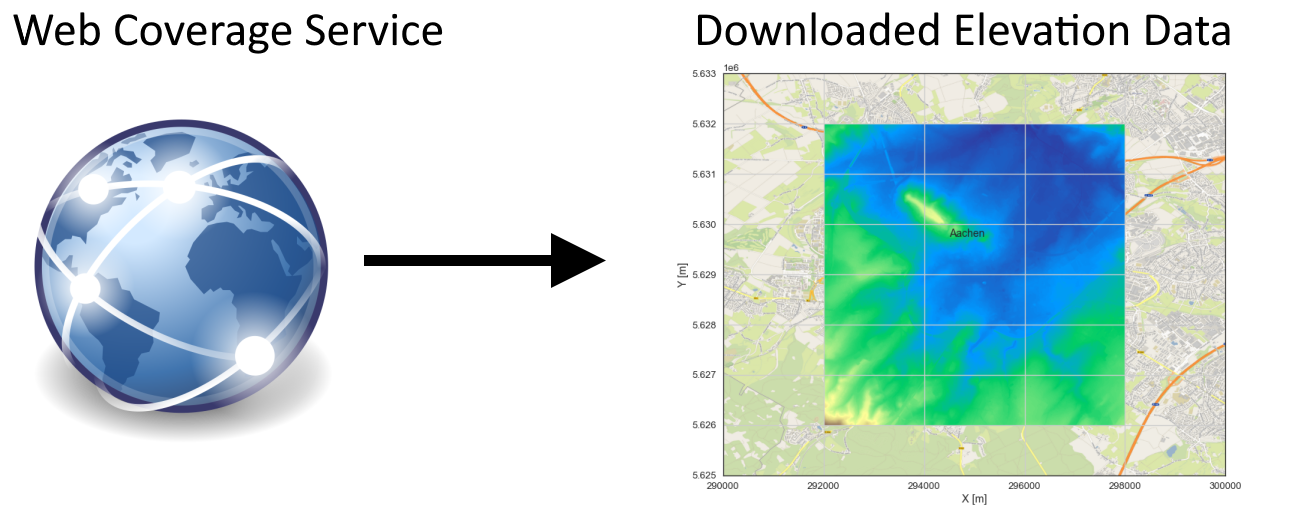
The Web Coverage Service (WCS) is a standard issued by the Open Geospatial Consortium (OGC). It is designed to simplify remote access to coverages, commonly known as raster maps in GIS. WCS functions over the HTTP protocol, setting out how to obtain data and meta-data using the requests available in that protocol. In practice it allows raster maps to be obtained from a web browser or from any other programme that uses the protocol.
Source: https://www.isric.org/web-coverage-services-wcs
Set File Paths and download Tutorial Data#
If you downloaded the latest GemGIS version from the Github repository, append the path so that the package can be imported successfully. Otherwise, it is recommended to install GemGIS via pip install gemgis and import GemGIS using import gemgis as gg. In addition, the file path to the folder where the data is being stored is set. The tutorial data is downloaded using Pooch (https://www.fatiando.org/pooch/latest/index.html) and stored in the specified folder. Use
pip install pooch if Pooch is not installed on your system yet.
[1]:
import gemgis as gg

file_path ='data/21_working_with_web_coverage_services/'
WARNING (theano.configdefaults): g++ not available, if using conda: `conda install m2w64-toolchain`
C:\Users\ale93371\Anaconda3\envs\test_gempy\lib\site-packages\theano\configdefaults.py:560: UserWarning: DeprecationWarning: there is no c++ compiler.This is deprecated and with Theano 0.11 a c++ compiler will be mandatory
  warnings.warn("DeprecationWarning: there is no c++ compiler."
WARNING (theano.configdefaults): g++ not detected ! Theano will be unable to execute optimized C-implementations (for both CPU and GPU) and will default to Python implementations. Performance will be severely degraded. To remove this warning, set Theano flags cxx to an empty string.
WARNING (theano.tensor.blas): Using NumPy C-API based implementation for BLAS functions.
Loading the WCS Service and loading WMS Data#
For this example, the digital elevation model of the State of Northrhine Westfalia will be downloaded. More information and the license for using the data can be found here.
Loading the WCS Service#
The WCS Server is being accessed via OWSLib. The attributes url and version are needed for the following request.
[2]:
wcs_url = 'https://www.wcs.nrw.de/geobasis/wcs_nw_dgm'
wcs = gg.web.load_wcs(url=wcs_url)
print(type(wcs))
wcs
<class 'owslib.coverage.wcs201.WebCoverageService_2_0_1'>
[2]:
<owslib.coverage.wcs201.WebCoverageService_2_0_1 at 0x27d3d027a00>
[3]:
wcs.url
[3]:
'https://www.wcs.nrw.de/geobasis/wcs_nw_dgm'
[4]:
wcs.version
[4]:
'2.0.1'
Load WMS Layer and Map#
A map of the Aachen area is loaded to later on plot the downloaded Digital Elevation Model data.
[5]:
wms = gg.web.load_wms('https://ows.terrestris.de/osm/service?')
[6]:
wms_map = gg.web.load_as_array('https://ows.terrestris.de/osm/service?',
                             'OSM-WMS', 'default', 'EPSG:25832', [290000, 300000,5624000,5634000], [2000, 2000], 'image/png')
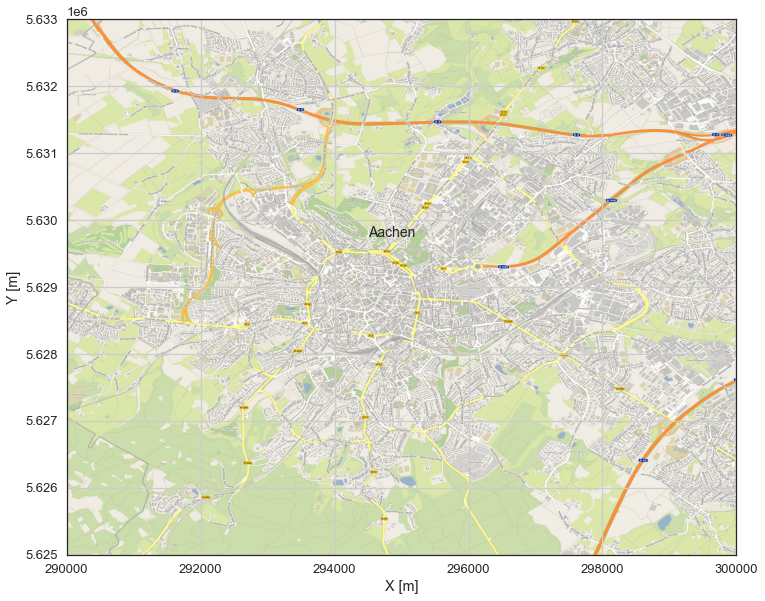
Plot WMS Data#
[7]:
import matplotlib.pyplot as plt

plt.figure(figsize = (12,12))
plt.imshow(wms_map, extent= [290000, 300000,5625000,5633000])
plt.grid()
plt.ylabel('Y [m]')
plt.xlabel('X [m]')
plt.text(294500,5629750, 'Aachen', size = 14)
[7]:
Text(294500, 5629750, 'Aachen')
Creating and Executing WCS Request#
The WCS needs to be created by providing min and max values for X and Y locations. Here, a for loop is created to automatically download four tiles with an extent of 2 by 2 km each. Due to their size, they will be saved outside the repository.
[8]:
gg.web.load_as_files(wcs_url=wcs.url,
                     version=wcs.version,
                     identifier='nw_dgm',
                     form='image/tiff',
                     extent=[292000, 298000, 5626000, 5632000],
                     size=2000,
                     path=file_path,
                     create_directory=True)
0%| | 0/3 [00:00<?, ?it/s]
Extent X:  6000  m
Extent Y:  6000  m
Number of tiles in X directions:  3
Number of tiles in Y directions:  3
Total Number of Tiles:  9
https://www.wcs.nrw.de/geobasis/wcs_nw_dgm?REQUEST=GetCoverage&SERVICE=WCS&VERSION=2.0.1&COVERAGEID=nw_dgm&FORMAT=image/tiff&SUBSET=x(292000,294000)&SUBSET=y(5626000,5628000)&OUTFILE=data/21_working_with_web_coverage_services/
https://www.wcs.nrw.de/geobasis/wcs_nw_dgm?REQUEST=GetCoverage&SERVICE=WCS&VERSION=2.0.1&COVERAGEID=nw_dgm&FORMAT=image/tiff&SUBSET=x(292000,294000)&SUBSET=y(5628000,5630000)&OUTFILE=data/21_working_with_web_coverage_services/
https://www.wcs.nrw.de/geobasis/wcs_nw_dgm?REQUEST=GetCoverage&SERVICE=WCS&VERSION=2.0.1&COVERAGEID=nw_dgm&FORMAT=image/tiff&SUBSET=x(292000,294000)&SUBSET=y(5630000,5632000)&OUTFILE=data/21_working_with_web_coverage_services/
33%|████████████████████████████ | 1/3 [00:04<00:09, 4.59s/it]
https://www.wcs.nrw.de/geobasis/wcs_nw_dgm?REQUEST=GetCoverage&SERVICE=WCS&VERSION=2.0.1&COVERAGEID=nw_dgm&FORMAT=image/tiff&SUBSET=x(294000,296000)&SUBSET=y(5626000,5628000)&OUTFILE=data/21_working_with_web_coverage_services/
https://www.wcs.nrw.de/geobasis/wcs_nw_dgm?REQUEST=GetCoverage&SERVICE=WCS&VERSION=2.0.1&COVERAGEID=nw_dgm&FORMAT=image/tiff&SUBSET=x(294000,296000)&SUBSET=y(5628000,5630000)&OUTFILE=data/21_working_with_web_coverage_services/
https://www.wcs.nrw.de/geobasis/wcs_nw_dgm?REQUEST=GetCoverage&SERVICE=WCS&VERSION=2.0.1&COVERAGEID=nw_dgm&FORMAT=image/tiff&SUBSET=x(294000,296000)&SUBSET=y(5630000,5632000)&OUTFILE=data/21_working_with_web_coverage_services/
67%|████████████████████████████████████████████████████████ | 2/3 [00:09<00:04, 4.64s/it]
https://www.wcs.nrw.de/geobasis/wcs_nw_dgm?REQUEST=GetCoverage&SERVICE=WCS&VERSION=2.0.1&COVERAGEID=nw_dgm&FORMAT=image/tiff&SUBSET=x(296000,298000)&SUBSET=y(5626000,5628000)&OUTFILE=data/21_working_with_web_coverage_services/
https://www.wcs.nrw.de/geobasis/wcs_nw_dgm?REQUEST=GetCoverage&SERVICE=WCS&VERSION=2.0.1&COVERAGEID=nw_dgm&FORMAT=image/tiff&SUBSET=x(296000,298000)&SUBSET=y(5628000,5630000)&OUTFILE=data/21_working_with_web_coverage_services/
https://www.wcs.nrw.de/geobasis/wcs_nw_dgm?REQUEST=GetCoverage&SERVICE=WCS&VERSION=2.0.1&COVERAGEID=nw_dgm&FORMAT=image/tiff&SUBSET=x(296000,298000)&SUBSET=y(5630000,5632000)&OUTFILE=data/21_working_with_web_coverage_services/
100%|████████████████████████████████████████████████████████████████████████████████████| 3/3 [00:13<00:00, 4.67s/it]
Create List of File paths#
A list of file paths is created for the subsequent merging of the data.
[9]:
dem_fps = gg.raster.create_filepaths(dirpath=file_path,
                                     search_criteria='tile*.tif')
dem_fps[:4]
[9]:
['C:\\Users\\ale93371\\Documents\\gemgis\\docs\\getting_started\\tutorial\\data\\21_working_with_web_coverage_services\\tile_292000_294000_5626000_5628000.tif',
 'C:\\Users\\ale93371\\Documents\\gemgis\\docs\\getting_started\\tutorial\\data\\21_working_with_web_coverage_services\\tile_292000_294000_5628000_5630000.tif',
 'C:\\Users\\ale93371\\Documents\\gemgis\\docs\\getting_started\\tutorial\\data\\21_working_with_web_coverage_services\\tile_292000_294000_5630000_5632000.tif',
 'C:\\Users\\ale93371\\Documents\\gemgis\\docs\\getting_started\\tutorial\\data\\21_working_with_web_coverage_services\\tile_294000_296000_5626000_5628000.tif']
Create List of Tiles#
The above created list of file paths is automatically being created when executing the function below. In addition, a list of the loaded tiles is created.
[10]:
src_files_to_mosaic = gg.raster.create_src_list(filepaths=dem_fps)
src_files_to_mosaic[:15]
[10]:
[<open DatasetReader name='C:/Users/ale93371/Documents/gemgis/docs/getting_started/tutorial/data/21_working_with_web_coverage_services/tile_292000_294000_5626000_5628000.tif' mode='r'>,
 <open DatasetReader name='C:/Users/ale93371/Documents/gemgis/docs/getting_started/tutorial/data/21_working_with_web_coverage_services/tile_292000_294000_5628000_5630000.tif' mode='r'>,
 <open DatasetReader name='C:/Users/ale93371/Documents/gemgis/docs/getting_started/tutorial/data/21_working_with_web_coverage_services/tile_292000_294000_5630000_5632000.tif' mode='r'>,
 <open DatasetReader name='C:/Users/ale93371/Documents/gemgis/docs/getting_started/tutorial/data/21_working_with_web_coverage_services/tile_294000_296000_5626000_5628000.tif' mode='r'>,
 <open DatasetReader name='C:/Users/ale93371/Documents/gemgis/docs/getting_started/tutorial/data/21_working_with_web_coverage_services/tile_294000_296000_5628000_5630000.tif' mode='r'>,
 <open DatasetReader name='C:/Users/ale93371/Documents/gemgis/docs/getting_started/tutorial/data/21_working_with_web_coverage_services/tile_294000_296000_5630000_5632000.tif' mode='r'>,
 <open DatasetReader name='C:/Users/ale93371/Documents/gemgis/docs/getting_started/tutorial/data/21_working_with_web_coverage_services/tile_296000_298000_5626000_5628000.tif' mode='r'>,
 <open DatasetReader name='C:/Users/ale93371/Documents/gemgis/docs/getting_started/tutorial/data/21_working_with_web_coverage_services/tile_296000_298000_5628000_5630000.tif' mode='r'>,
 <open DatasetReader name='C:/Users/ale93371/Documents/gemgis/docs/getting_started/tutorial/data/21_working_with_web_coverage_services/tile_296000_298000_5630000_5632000.tif' mode='r'>]
Merge tiles to mosaic#
The single files can now automatically be merged to form a mosaic. In addition, the transform of the raster is being returned to save the raster later on.
[11]:
mosaic, transform = gg.raster.merge_tiles(src_files=src_files_to_mosaic)
[12]:
mosaic
[12]:
array([[200.72, 200.73, 200.72, ..., 204.42, 204.45, 204.45],
       [200.74, 200.74, 200.75, ..., 204.43, 204.44, 204.48],
       [200.76, 200.76, 200.76, ..., 204.42, 204.48, 204.5 ],
       ...,
       [329.15, 328.86, 328.74, ..., 242.45, 242.38, 242.28],
       [329.29, 329.06, 328.87, ..., 242.45, 242.39, 242.31],
       [329.47, 329.3 , 329.09, ..., 242.42, 242.37, 242.32]],
      dtype=float32)
[13]:
transform
[13]:
Affine(1.0, 0.0, 292000.0,
       0.0, -1.0, 5632000.0)
Safe Raster to disc#
[14]:
import numpy as np
gg.raster.save_as_tiff(raster=np.flipud(mosaic),
                       path=file_path +'raster.tif',
                       extent=[292000,298000,5626000,5632000],
                       crs='EPSG:25832',
                       transform=transform,
                       overwrite_file=True)
Raster successfully saved
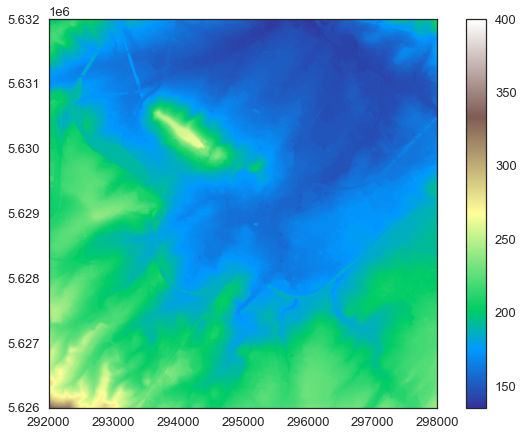
Plot DEM#
The mosaic/DEM can now be plotted using the built-in rasterio functionality or using matplotlib.
[15]:
im = plt.imshow(mosaic, cmap='terrain', vmax=400, extent = [292000,298000,5626000,5632000])
plt.colorbar(im)
[15]:
<matplotlib.colorbar.Colorbar at 0x27d3d1a3760>
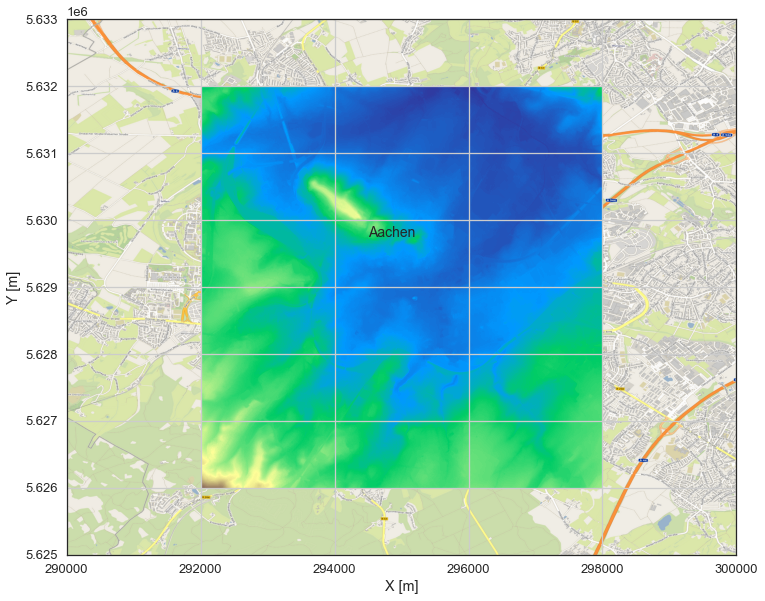
[16]:
plt.figure(figsize = (12,12))
plt.imshow(wms_map, extent= [290000, 300000,5625000,5633000])
plt.grid()
plt.ylabel('Y [m]')
plt.xlabel('X [m]')
plt.text(294500,5629750, 'Aachen', size = 14)
im = plt.imshow(mosaic, cmap='terrain', vmax=400, extent = [292000,298000,5626000,5632000])
plt.xlim(290000, 300000)
plt.ylim(5625000,5633000)
[16]:
(5625000.0, 5633000.0)