
24 Plotting Hypocenters of Earthquakes with PyVista
Contents
24 Plotting Hypocenters of Earthquakes with PyVista#
Hypocenters of earthquake can be nicely visualized using GemGIS and PyVista.
Set File Paths and download Tutorial Data#
If you downloaded the latest GemGIS version from the Github repository, append the path so that the package can be imported successfully. Otherwise, it is recommended to install GemGIS via pip install gemgis and import GemGIS using import gemgis as gg. In addition, the file path to the folder where the data is being stored is set. The tutorial data is downloaded using Pooch (https://www.fatiando.org/pooch/latest/index.html) and stored in the specified folder. Use
pip install pooch if Pooch is not installed on your system yet.
[1]:
import gemgis as gg

file_path ='data/24_plotting_hypocenters_of_earthquakes/'
WARNING (theano.configdefaults): g++ not available, if using conda: `conda install m2w64-toolchain`
C:\Users\ale93371\Anaconda3\envs\test_gempy\lib\site-packages\theano\configdefaults.py:560: UserWarning: DeprecationWarning: there is no c++ compiler.This is deprecated and with Theano 0.11 a c++ compiler will be mandatory
  warnings.warn("DeprecationWarning: there is no c++ compiler."
WARNING (theano.configdefaults): g++ not detected ! Theano will be unable to execute optimized C-implementations (for both CPU and GPU) and will default to Python implementations. Performance will be severely degraded. To remove this warning, set Theano flags cxx to an empty string.
WARNING (theano.tensor.blas): Using NumPy C-API based implementation for BLAS functions.
[2]:
gg.download_gemgis_data.download_tutorial_data(filename="24_plotting_hypocenters_of_earthquakes.zip", dirpath=file_path)
Load Earthquake Data#
The data used here was obtained from the earthquake catalog of the Earthquake Station of the University of Cologne in Bensberg (http://www.seismo.uni-koeln.de/catalog/index.htm)
import gemgis as gg import pandas as pd data = pd.read_csv(file_path + 'earthquakes_aachen.csv', delimiter=';').dropna() data.head(15)data = data[data['Magnitude'] != '-'] data = data[data['Tiefe [km]'] != '-'] data.head(10)data['Magnitude'] = pd.to_numeric(data['Magnitude']) data['Tiefe [km]'] = pd.to_numeric(data['Tiefe [km]']) data['Date'] = pd.to_datetime(data['Date']) data['Year'] = pd.DatetimeIndex(data['Date']).year data['X'] = pd.to_numeric(data['X']) data['Y'] = pd.to_numeric(data['Y']) data['Z'] = pd.to_numeric(data['Z'])Converting Pandas DataFrame to GeoDataFrame and reproject coordinates#
[3]:
import geopandas as gpd
gdf = gpd.read_file(filename= file_path+'earthquake_data.shp')
[4]:
#gdf = gpd.GeoDataFrame(data, geometry=gpd.points_from_xy(data.X, data.Y), crs='EPSG:4326').to_crs('EPSG:4647').reset_index()

gdf = gg.vector.extract_xy(gdf=gdf, reset_index=True)
gdf.head()
[4]:
| Y | X | Z | RASTERVALU | Tiefe [km] | Magnitude | Epizentrum | Year | geometry | |
|---|---|---|---|---|---|---|---|---|---|
| 0 | 5645741.63 | 32322660.15 | -8249.25 | 150.75 | 8.40 | 1.50 | STETTERNICH | 2002 | POINT (32322660.151 5645741.630) |
| 1 | 5645947.18 | 32323159.51 | 89.63 | 89.63 | 0.00 | 0.80 | SOPHIENHOEHE | 2014 | POINT (32323159.505 5645947.183) |
| 2 | 5637979.08 | 32306261.57 | -14056.14 | 143.86 | 14.20 | 2.20 | ALSDORF | 2007 | POINT (32306261.571 5637979.080) |
| 3 | 5645345.19 | 32321239.77 | -8124.22 | 275.78 | 8.40 | 1.70 | STETTERNICH | 1999 | POINT (32321239.770 5645345.189) |
| 4 | 5645698.15 | 32320689.25 | -5329.58 | 270.42 | 5.60 | 1.90 | STETTERNICH | 1999 | POINT (32320689.249 5645698.148) |
Loading WMS Data for Plotting#
[5]:
wms = gg.web.load_wms(url='https://ows.terrestris.de/osm/service?')
[6]:
wms_map = gg.web.load_as_array(url=wms.url,
                               layer='OSM-WMS',
                               style='default',
                               crs='EPSG:4647',
                               bbox=[32286000,32328000, 5620000,5648000],
                               size=[4200, 2800],
                               filetype='image/png')
Plotting the data#
[7]:
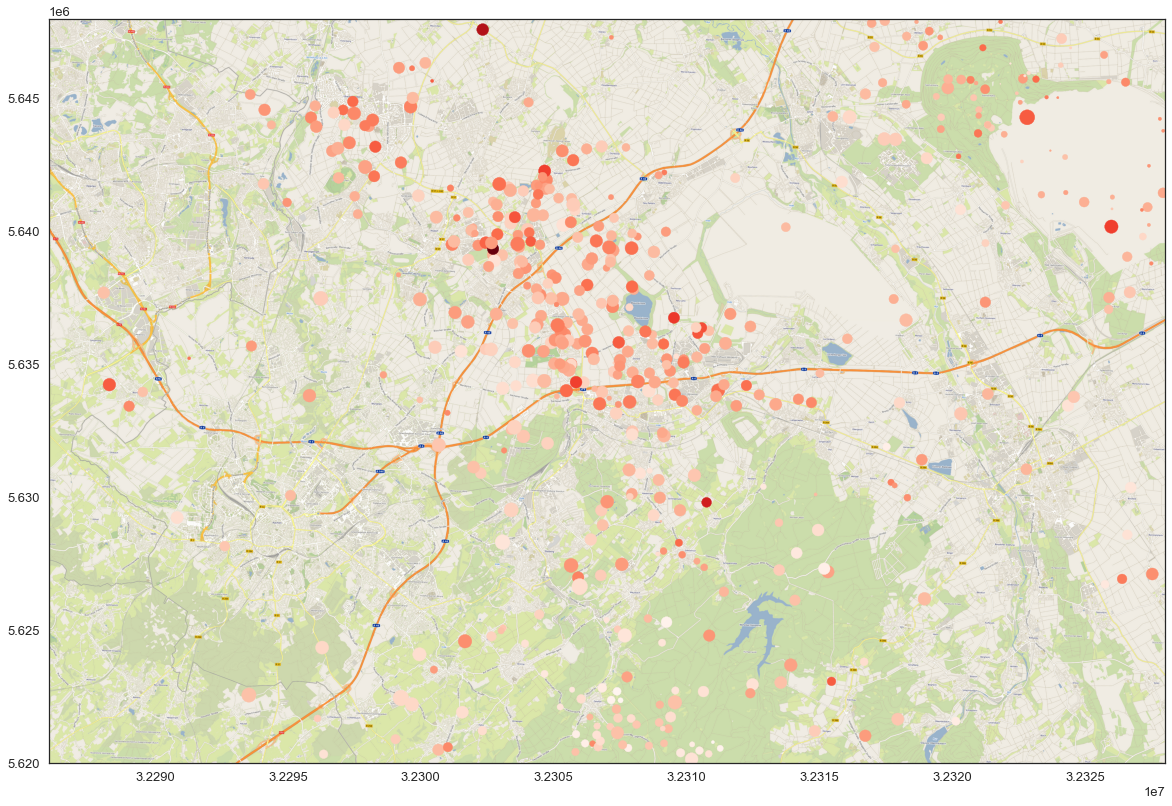
import matplotlib.pyplot as plt

fig, ax = plt.subplots(1,1, figsize=(20,20))

ax.imshow(wms_map, extent=[32286000,32328000, 5620000,5648000])
gdf.plot(ax=ax, aspect='equal', column='Magnitude', cmap='Reds', markersize = gdf['Tiefe [km]'].values*10)
[7]:
<AxesSubplot:>
Create PyVista Spheres#
[8]:
import pyvista as pv

test = pv.Sphere(radius=1000, center=gdf.loc[0][['X', 'Y', 'Z']].tolist())
test
[8]:
| Header | Data Arrays | ||||||||||||||||||||||||||
|---|---|---|---|---|---|---|---|---|---|---|---|---|---|---|---|---|---|---|---|---|---|---|---|---|---|---|---|
|
|
[9]:
import numpy as np

spheres = pv.MultiBlock([pv.Sphere(radius=gdf.loc[i]['Magnitude']*200, center=gdf.loc[i][['X', 'Y', 'Z']].tolist()) for i in range(len(gdf))])

for i in range(len(spheres.keys())):
    spheres[spheres.keys()[i]]['Magnitude'] = np.zeros(len(spheres[spheres.keys()[i]].points)) + gdf.loc[i]['Magnitude']
    spheres[spheres.keys()[i]]['Year'] = np.zeros(len(spheres[spheres.keys()[i]].points)) + gdf.loc[i]['Year']
[10]:
type(spheres)
[10]:
pyvista.core.composite.MultiBlock
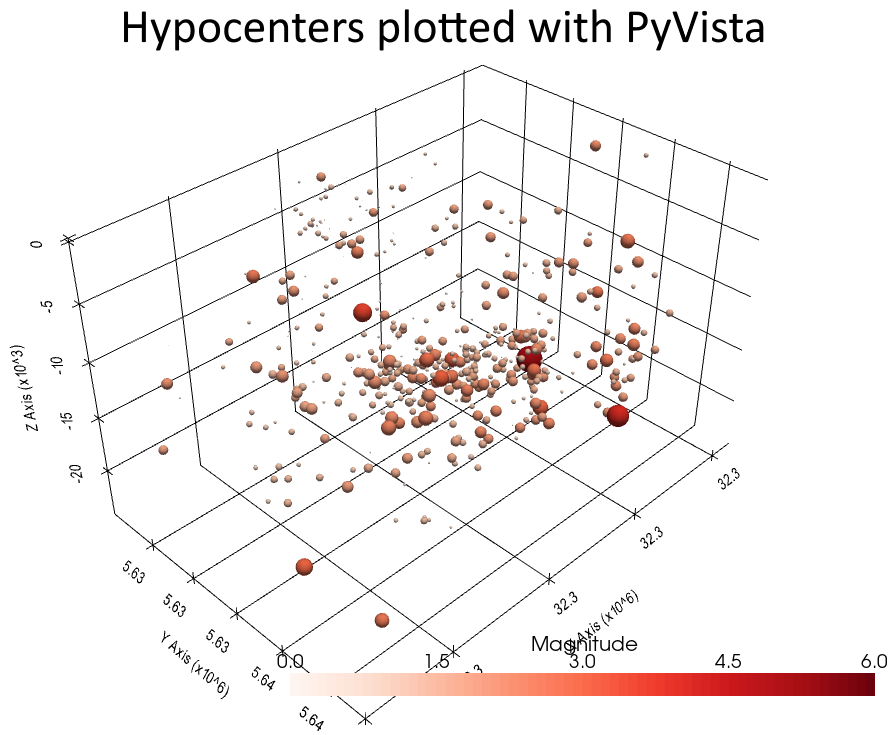
[11]:
sargs = dict(fmt="%.1f", color='black')

p = pv.Plotter(notebook=True)

p.add_mesh(spheres,scalars='Magnitude', cmap='Reds', clim=[0,6], scalar_bar_args=sargs)

p.set_background('white')
p.show_grid(color='black')
p.show()
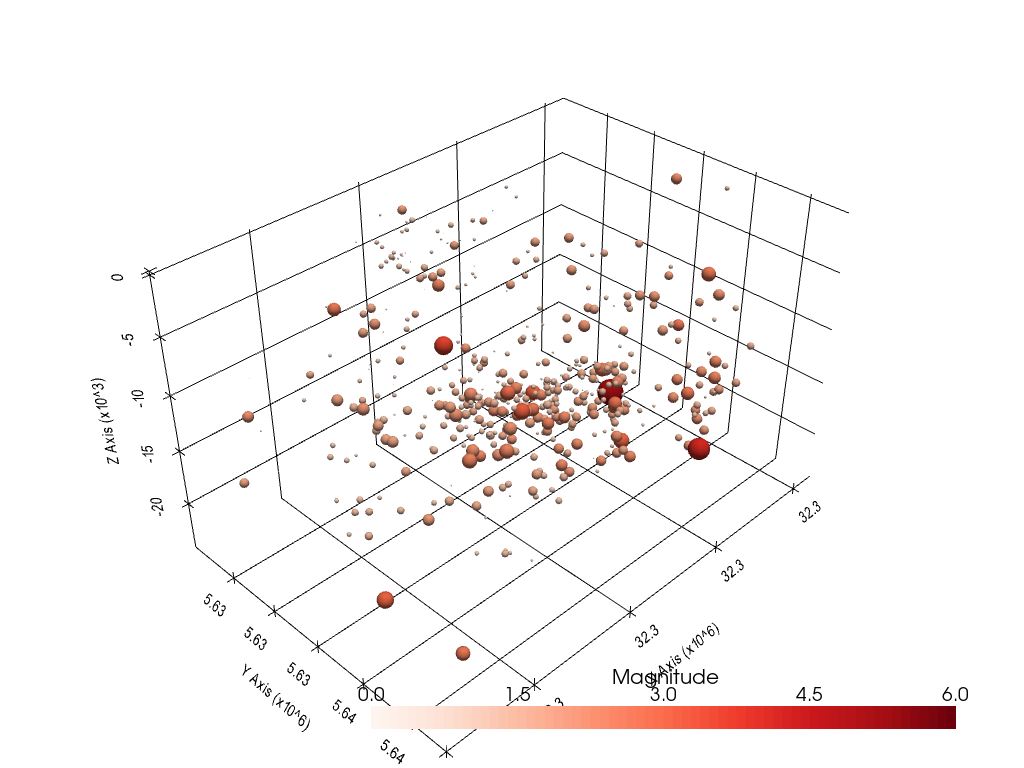
The above shown steps are also combined in the function create_meshes_hypocenters(..).
[12]:
spheres = gg.visualization.create_meshes_hypocenters(gdf=gdf)
spheres
[12]:
| Information | Blocks | ||||||||||||||||||||||||||||||||||||||||||||||||||||||||||||||||||||||||||||||||||||||||||||||||||||||||||||||||||||||||||||||||||||||||||||||||||||||||||||||||||||||||||||||||||||||||||||||||||||||||||||||||||||||||||||||||||||||||||||||||||||||||||||||||||||||||||||||||||||||||||||||||||||||||||||||||||||||||||||||||||||||||||||||||||||||||||||||||||||||||||||||||||||||||||||||||||||||||||||||||||||||||||||||||||||||||||||||||||||||||||||||||||||||||||||||||||||||||||||||||||||||||||||||||||||||||||||||||||||||||||||||||||||||||||||||||||||||||||||||||||||||||||||||||||||||||||||||||||||||||||||||||||||||||||||||||||||||||||||||||||||||||||||||||||||||||||||||||||||||||||||||||||||||||||||||||||||||||||||||||||||||||||||||||||||||||||||||||||||||||||||||||||||||||||||||||||||||||||||||||||||||||||||||||||||||||||||||||||||||||||||||||||||||||||||||||||||||||||||||||||||||||||||||||||||||||||||||||||||||||||||||||||||||||||||||||||||||||||||||||||||||||||||||||||||||||||||||||||||||
|---|---|---|---|---|---|---|---|---|---|---|---|---|---|---|---|---|---|---|---|---|---|---|---|---|---|---|---|---|---|---|---|---|---|---|---|---|---|---|---|---|---|---|---|---|---|---|---|---|---|---|---|---|---|---|---|---|---|---|---|---|---|---|---|---|---|---|---|---|---|---|---|---|---|---|---|---|---|---|---|---|---|---|---|---|---|---|---|---|---|---|---|---|---|---|---|---|---|---|---|---|---|---|---|---|---|---|---|---|---|---|---|---|---|---|---|---|---|---|---|---|---|---|---|---|---|---|---|---|---|---|---|---|---|---|---|---|---|---|---|---|---|---|---|---|---|---|---|---|---|---|---|---|---|---|---|---|---|---|---|---|---|---|---|---|---|---|---|---|---|---|---|---|---|---|---|---|---|---|---|---|---|---|---|---|---|---|---|---|---|---|---|---|---|---|---|---|---|---|---|---|---|---|---|---|---|---|---|---|---|---|---|---|---|---|---|---|---|---|---|---|---|---|---|---|---|---|---|---|---|---|---|---|---|---|---|---|---|---|---|---|---|---|---|---|---|---|---|---|---|---|---|---|---|---|---|---|---|---|---|---|---|---|---|---|---|---|---|---|---|---|---|---|---|---|---|---|---|---|---|---|---|---|---|---|---|---|---|---|---|---|---|---|---|---|---|---|---|---|---|---|---|---|---|---|---|---|---|---|---|---|---|---|---|---|---|---|---|---|---|---|---|---|---|---|---|---|---|---|---|---|---|---|---|---|---|---|---|---|---|---|---|---|---|---|---|---|---|---|---|---|---|---|---|---|---|---|---|---|---|---|---|---|---|---|---|---|---|---|---|---|---|---|---|---|---|---|---|---|---|---|---|---|---|---|---|---|---|---|---|---|---|---|---|---|---|---|---|---|---|---|---|---|---|---|---|---|---|---|---|---|---|---|---|---|---|---|---|---|---|---|---|---|---|---|---|---|---|---|---|---|---|---|---|---|---|---|---|---|---|---|---|---|---|---|---|---|---|---|---|---|---|---|---|---|---|---|---|---|---|---|---|---|---|---|---|---|---|---|---|---|---|---|---|---|---|---|---|---|---|---|---|---|---|---|---|---|---|---|---|---|---|---|---|---|---|---|---|---|---|---|---|---|---|---|---|---|---|---|---|---|---|---|---|---|---|---|---|---|---|---|---|---|---|---|---|---|---|---|---|---|---|---|---|---|---|---|---|---|---|---|---|---|---|---|---|---|---|---|---|---|---|---|---|---|---|---|---|---|---|---|---|---|---|---|---|---|---|---|---|---|---|---|---|---|---|---|---|---|---|---|---|---|---|---|---|---|---|---|---|---|---|---|---|---|---|---|---|---|---|---|---|---|---|---|---|---|---|---|---|---|---|---|---|---|---|---|---|---|---|---|---|---|---|---|---|---|---|---|---|---|---|---|---|---|---|---|---|---|---|---|---|---|---|---|---|---|---|---|---|---|---|---|---|---|---|---|---|---|---|---|---|---|---|---|---|---|---|---|---|---|---|---|---|---|---|---|---|---|---|---|---|---|---|---|---|---|---|---|---|---|---|---|---|---|---|---|---|---|---|---|---|---|---|---|---|---|---|---|---|---|---|---|---|---|---|---|---|---|---|---|---|---|---|---|---|---|---|---|---|---|---|---|---|---|---|---|---|---|---|---|---|---|---|---|---|---|---|---|---|---|---|---|---|---|---|---|---|---|---|---|---|---|---|---|---|---|---|---|---|---|---|---|---|---|---|---|---|---|---|---|---|---|---|---|---|---|---|---|---|---|---|---|---|---|---|---|---|---|---|---|---|---|---|---|---|---|---|---|---|---|---|---|---|---|---|---|---|---|---|---|---|---|---|---|---|---|---|---|---|---|---|---|---|---|---|---|---|---|---|---|---|---|---|---|---|---|---|---|---|---|---|---|---|---|---|---|---|---|---|---|---|---|---|---|---|---|---|---|---|---|---|---|---|---|---|---|---|---|---|---|---|---|---|---|---|---|---|---|---|---|---|---|---|---|---|---|---|---|---|---|---|---|---|---|---|---|---|---|---|---|---|---|---|---|---|---|---|---|---|---|---|---|---|---|---|---|---|---|---|---|---|---|---|---|---|---|---|---|---|---|---|---|---|---|---|---|---|---|---|---|---|---|---|---|---|---|---|---|---|---|---|---|---|---|---|---|---|---|---|---|---|---|---|---|---|---|---|---|---|---|---|---|---|---|---|---|---|---|---|---|---|---|---|---|---|---|---|---|---|
|
|
[13]:
sargs = dict(fmt="%.1f", color='black')

p = pv.Plotter(notebook=True)

p.add_mesh(spheres,scalars='Magnitude', cmap='Reds', clim=[0,6], scalar_bar_args=sargs)

p.set_background('white')
p.show_grid(color='black')
p.show()
