26 Working with Well Data from the Geological Survey NRW
Contents
26 Working with Well Data from the Geological Survey NRW#
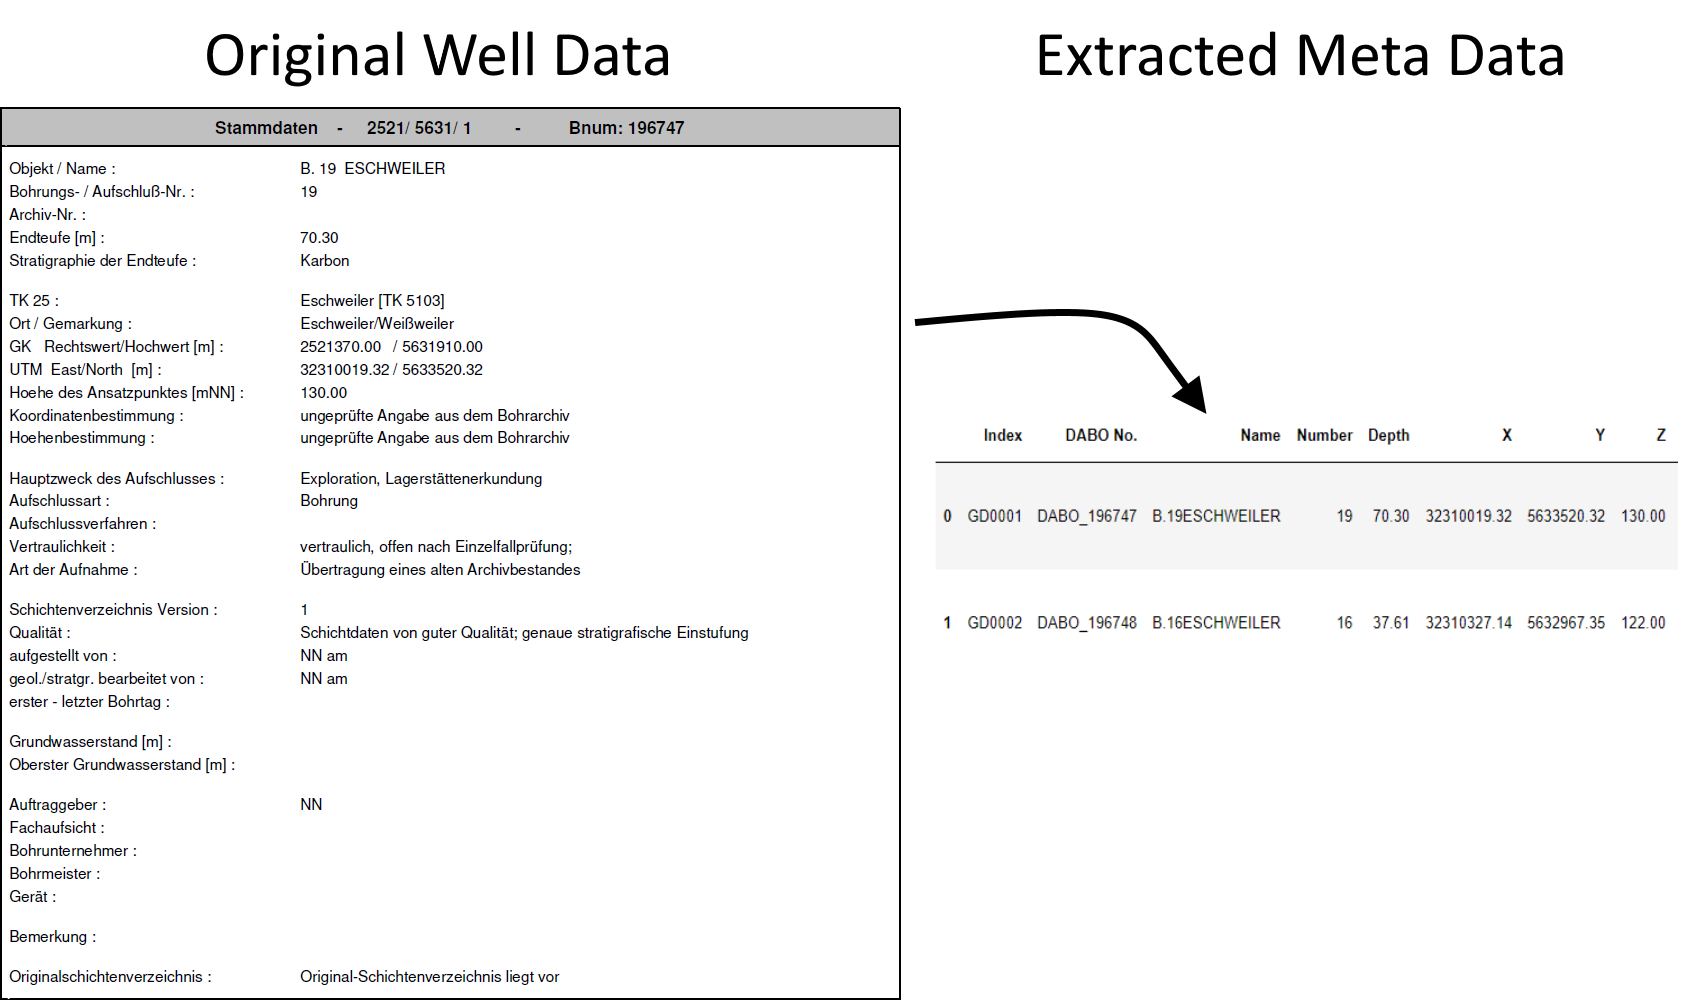
This notebook presents the extraction of borehole data (location of wells and stratigraphy) from logs provided by the Geological Survey NRW.
Set File Paths and download Tutorial Data#
If you downloaded the latest GemGIS version from the Github repository, append the path so that the package can be imported successfully. Otherwise, it is recommended to install GemGIS via pip install gemgis and import GemGIS using import gemgis as gg. In addition, the file path to the folder where the data is being stored is set. The tutorial data is downloaded using Pooch (https://www.fatiando.org/pooch/latest/index.html) and stored in the specified folder. Use
pip install pooch if Pooch is not installed on your system yet.
[1]:
import gemgis as gg

file_path ='data/26_working_with_well_data_from_GD_NRW/'
WARNING (theano.configdefaults): g++ not available, if using conda: `conda install m2w64-toolchain`
C:\Users\ale93371\Anaconda3\envs\test_gempy\lib\site-packages\theano\configdefaults.py:560: UserWarning: DeprecationWarning: there is no c++ compiler.This is deprecated and with Theano 0.11 a c++ compiler will be mandatory
  warnings.warn("DeprecationWarning: there is no c++ compiler."
WARNING (theano.configdefaults): g++ not detected ! Theano will be unable to execute optimized C-implementations (for both CPU and GPU) and will default to Python implementations. Performance will be severely degraded. To remove this warning, set Theano flags cxx to an empty string.
WARNING (theano.tensor.blas): Using NumPy C-API based implementation for BLAS functions.
[2]:
gg.download_gemgis_data.download_tutorial_data(filename="26_working_with_well_data_from_GD_NRW.zip", dirpath=file_path)
Loading the Well Data#
The data used for GemGIS is obtained from the Geological Survey NRW. It will be used under Datenlizenz Deutschland – Namensnennung – Version 2.0 (https://www.govdata.de/dl-de/by-2-0).
The PDF Files can be loaded as strings using PyPDF2.
[5]:
data = gg.misc.load_pdf(path=file_path + 'test_data.pdf')
data[:500]
100%|████████████████████████████████████████████████████████████████████████████████████| 2/2 [00:00<00:00, 37.16it/s]
../../../../gemgis_data/data/26_working_with_well_data_from_GD_NRW/test_data.txt successfully saved
[5]:
'Stammdaten - 2521/ 5631/ 1 - Bnum: 196747 . . Objekt / Name :B. 19 ESCHWEILER\n\n Bohrungs- / Aufschluß-Nr. :19\n\n Archiv-Nr. :\n Endteufe [m] :70.30\n\n Stratigraphie der Endteufe :Karbon\n . TK 25 :Eschweiler [TK 5103]\n\n Ort / Gemarkung :Eschweiler/Weißweiler\n\n GK Rechtswert/Hochwert [m] :2521370.00 / 5631910.00\n\n UTM East/North [m] :32310019.32 / 5633520.32\n\n Hoehe des Ansatzpunktes [mNN] :130.00\n\n Koordinatenbestimmung :ungeprüfte Angabe aus dem Bohrarch'
Extracting Meta Data From the Well Data#
The meta data or ‘Stammdaten’ of the wells can be extracted using get_meta_data_df(...). Any duplicate wells will be removed automatically.
[3]:
df = gg.misc.get_meta_data_df(data=data,
                              name='GD')
df
[3]:
| Index | DABO No. | Name | Number | Depth | X | Y | Z | X_GK | Y_GK | ... | Kind | Procedure | Confidentiality | Record Type | Lithlog Version | Quality | Drilling Period | Remarks | Availability Lithlog | geometry | |
|---|---|---|---|---|---|---|---|---|---|---|---|---|---|---|---|---|---|---|---|---|---|
| 0 | GD0001 | DABO_196747 | B.19ESCHWEILER | 19 | 70.30 | 32310019.32 | 5633520.32 | 130.00 | 2521370.00 | 5631910.00 | ... | Bohrung | vertraulich, offen nach Einzelfallprüfung; | Übertragung eines alten Archivbestandes | 1 | Schichtdaten von guter Qualität; genaue strati... | Original-Schichtenverzeichnis liegt vor | POINT (32310019.320 5633520.320) | |||
| 1 | GD0002 | DABO_196748 | B.16ESCHWEILER | 16 | 37.61 | 32310327.14 | 5632967.35 | 122.00 | 2521700.00 | 5631370.00 | ... | Bohrung | vertraulich, offen nach Einzelfallprüfung; | Übertragung eines alten Archivbestandes | 1 | Schichtdaten von guter Qualität; genaue strati... | Original-Schichtenverzeichnis liegt vor | POINT (32310327.140 5632967.350) |
2 rows × 26 columns
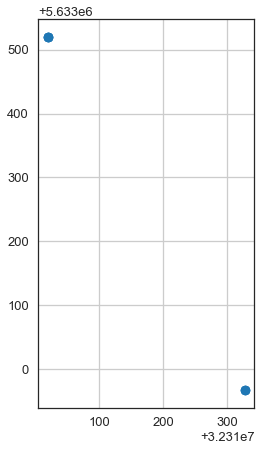
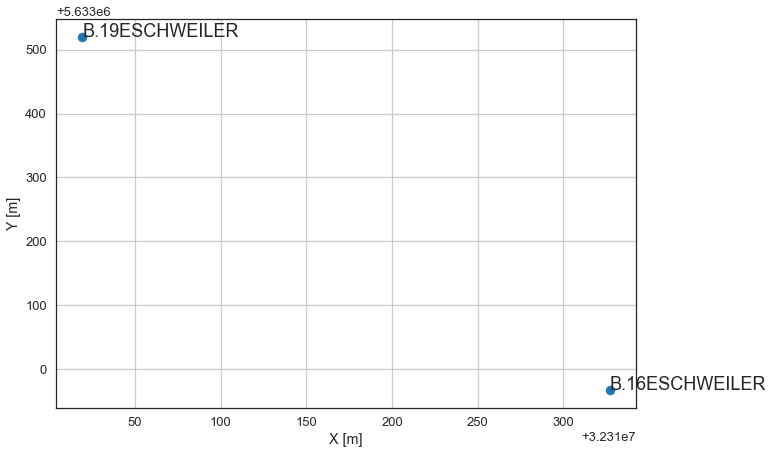
Plot Data#
The locations of the wells can easily be plotted using Matplotlib or the built-in GeoPandas functions.
[4]:
import matplotlib.pyplot as plt

plt.scatter(df['X'], df['Y'])
plt.grid()
plt.xlabel('X [m]')
plt.ylabel('Y [m]')
for i in range(len(df)):
    plt.text(df['X'].loc[i], df['Y'].loc[i], df['Name'].loc[i])
Extracting Stratigraphic Data from Well Data#
The stratigraphic data can be extracted using get_stratigraphic_data_df(..). Different files have to be loaded beforehand to make the workflow work. This includes a file containing symbols that will be filtered out and the classification of the different formations.
[5]:
data = gg.misc.load_pdf(path=file_path + 'test_data.pdf',
                        save_as_txt=True)

data[:500]
100%|████████████████████████████████████████████████████████████████████████████████████| 2/2 [00:00<00:00, 66.64it/s]
../../../../gemgis_data/data/26_working_with_well_data_from_GD_NRW/test_data.txt successfully saved
[5]:
'Stammdaten - 2521/ 5631/ 1 - Bnum: 196747 . . Objekt / Name :B. 19 ESCHWEILER\n\n Bohrungs- / Aufschluß-Nr. :19\n\n Archiv-Nr. :\n Endteufe [m] :70.30\n\n Stratigraphie der Endteufe :Karbon\n . TK 25 :Eschweiler [TK 5103]\n\n Ort / Gemarkung :Eschweiler/Weißweiler\n\n GK Rechtswert/Hochwert [m] :2521370.00 / 5631910.00\n\n UTM East/North [m] :32310019.32 / 5633520.32\n\n Hoehe des Ansatzpunktes [mNN] :130.00\n\n Koordinatenbestimmung :ungeprüfte Angabe aus dem Bohrarch'
Load Well Data from txt-file#
The data can be loaded from a text file so that the original PDF does not have to be reloaded again to save time.
[6]:
with open(file_path + 'test_data.txt', "r") as text_file:
    data = text_file.read()
Load Symbols from txt-file#
Symbols that will be removed by default from the well data can be loaded from a text file.
[7]:
with open(file_path + 'symbols.txt', "r") as text_file:
    symbols = [(i, '') for i in text_file.read().splitlines()]

symbols
[7]:
[('.m ', ''),
 (', ', ''),
 ('; ', ''),
 (': ', ''),
 ('/ ', ''),
 ('? ', ''),
 ('! ', ''),
 ('-"- ', ''),
 ('" ', ''),
 ('% ', ''),
 ('< ', ''),
 ('> ', ''),
 ('= ', ''),
 ('~ ', ''),
 ('_ ', ''),
 ('° ', ''),
 ("' ", '')]
Load Formations from txt-file#
Classified formations can be loaded from a text file.
[8]:
with open(file_path + 'formations.txt', "rb") as text_file:
    formations = text_file.read().decode("UTF-8").split()

formations = [(formations[i], formations[i+1]) for i in range(0,len(formations)-1,2)]
formations[:10]
[8]:
[('UnterdevonKalltalFormation', 'KalltalFM'),
 ('nullLöss', 'Quaternary'),
 ('QuartärFlugsand', 'Quaternary'),
 ('QuartärHauptterrassen', 'Quaternary'),
 ('QuartärSandlöss', 'Quaternary'),
 ('QuartärHochflutablagerungen', 'Quaternary'),
 ('QuartärAnthropogeneBildungen(künstlicheAufschüttung)', 'Quaternary'),
 ('QuartärVerschwemmungsablagerungenFrostbodenbildungenundRutschmassen',
  'Quaternary'),
 ('QuartärLösslehm', 'Quaternary'),
 ('QuartärHochflutlehm', 'Quaternary')]
Extracting the Stratigraphic Data#
After loading the symbols and formations, the stratigraphic data can be extracted. The (Geo-)DataFrame contains the index, the well name, X, Y and Z coordinates, the altitudes, the depths, the formations and a geometry column.
[9]:
df = gg.misc.get_stratigraphic_data_df(data=data,
                                       name='GD',
                                       symbols=symbols,
                                       formations=formations,
                                       return_gdf=True)
df
[9]:
| Index | Name | X | Y | Z | Altitude | Depth | formation | geometry | |
|---|---|---|---|---|---|---|---|---|---|
| 0 | GD0001 | B.19ESCHWEILER | 32310019.32 | 5633520.32 | 125.30 | 130.00 | 70.30 | Quaternary | POINT (32310019.320 5633520.320) |
| 1 | GD0001 | B.19ESCHWEILER | 32310019.32 | 5633520.32 | 66.50 | 130.00 | 70.30 | Miocene | POINT (32310019.320 5633520.320) |
| 2 | GD0001 | B.19ESCHWEILER | 32310019.32 | 5633520.32 | 60.90 | 130.00 | 70.30 | Oligocene | POINT (32310019.320 5633520.320) |
| 3 | GD0001 | B.19ESCHWEILER | 32310019.32 | 5633520.32 | 59.70 | 130.00 | 70.30 | Carboniferous | POINT (32310019.320 5633520.320) |
| 4 | GD0002 | B.16ESCHWEILER | 32310327.14 | 5632967.35 | 117.80 | 122.00 | 37.61 | Quaternary | POINT (32310327.140 5632967.350) |
| 5 | GD0002 | B.16ESCHWEILER | 32310327.14 | 5632967.35 | 84.40 | 122.00 | 37.61 | Miocene | POINT (32310327.140 5632967.350) |
| 6 | GD0002 | B.16ESCHWEILER | 32310327.14 | 5632967.35 | 84.39 | 122.00 | 37.61 | Carboniferous | POINT (32310327.140 5632967.350) |
Plotting data#
[10]:
df.plot()
plt.grid()