
12 Visualizing Geological Cross Sections with PyVista
Contents
12 Visualizing Geological Cross Sections with PyVista#
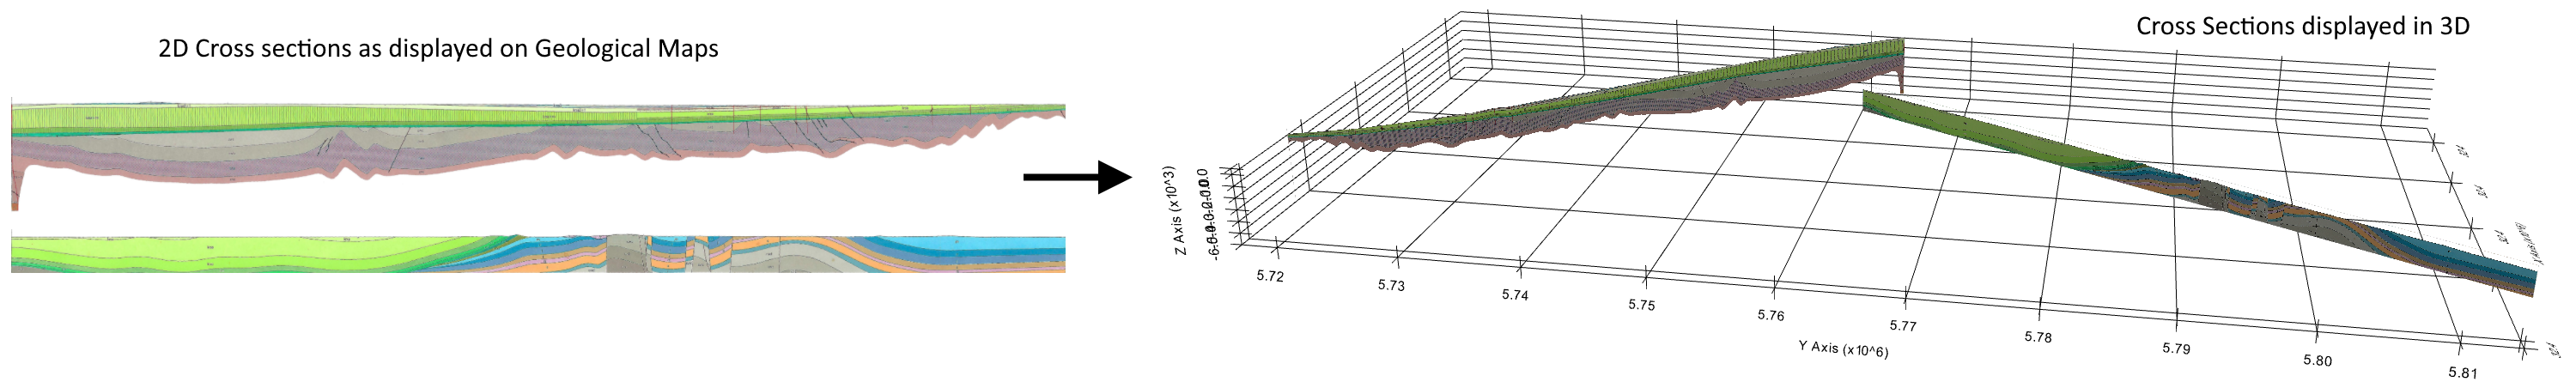
Geological Cross Sections obtained from Geological Maps can be loaded and plotted with PyVista in GemGIS. The following illustrates how to get data from a Geological Map into GemGIS.
Data Preparation#
The data used for GemGIS is obtained from OpenDataNRW. It will be used under Datenlizenz Deutschland – Namensnennung – Version 2.0 (https://www.govdata.de/dl-de/by-2-0) with © Geowissenschaftliche Daten: Analoges Kartenwerk der Geologischen Karte von Nordrhein-Westfalen 1:100.000 (2020).
Geological Maps#
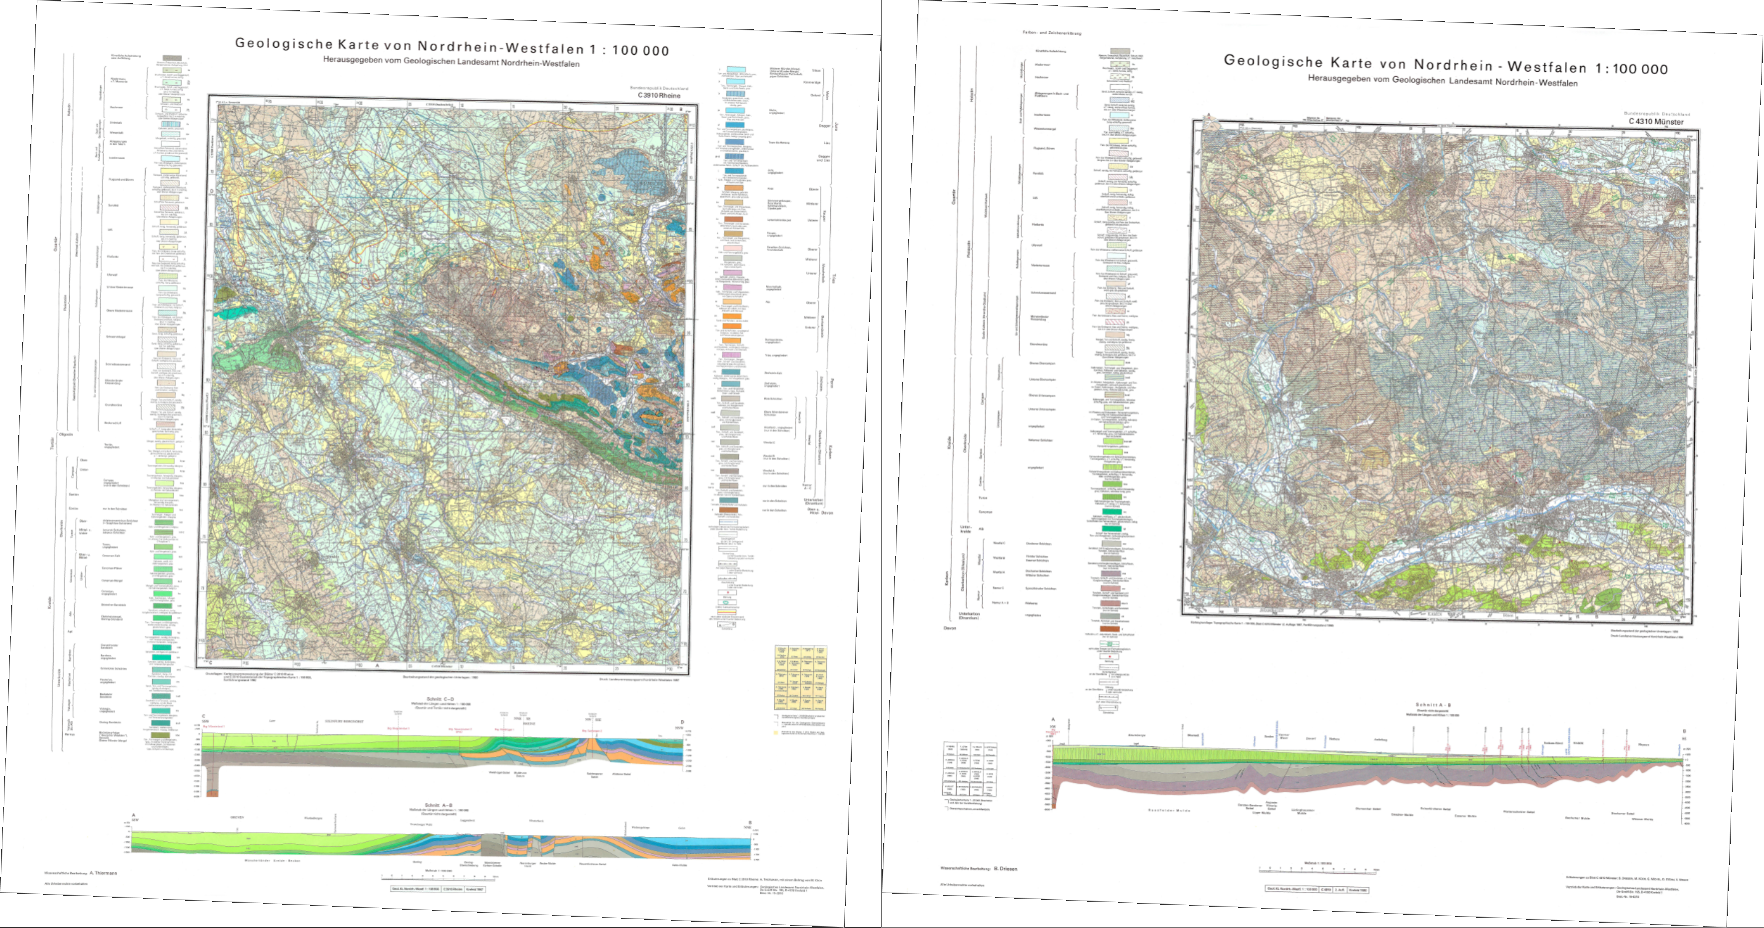
For the visualization of cross sections, the geological maps Münster and Rheine were taken as shown below.
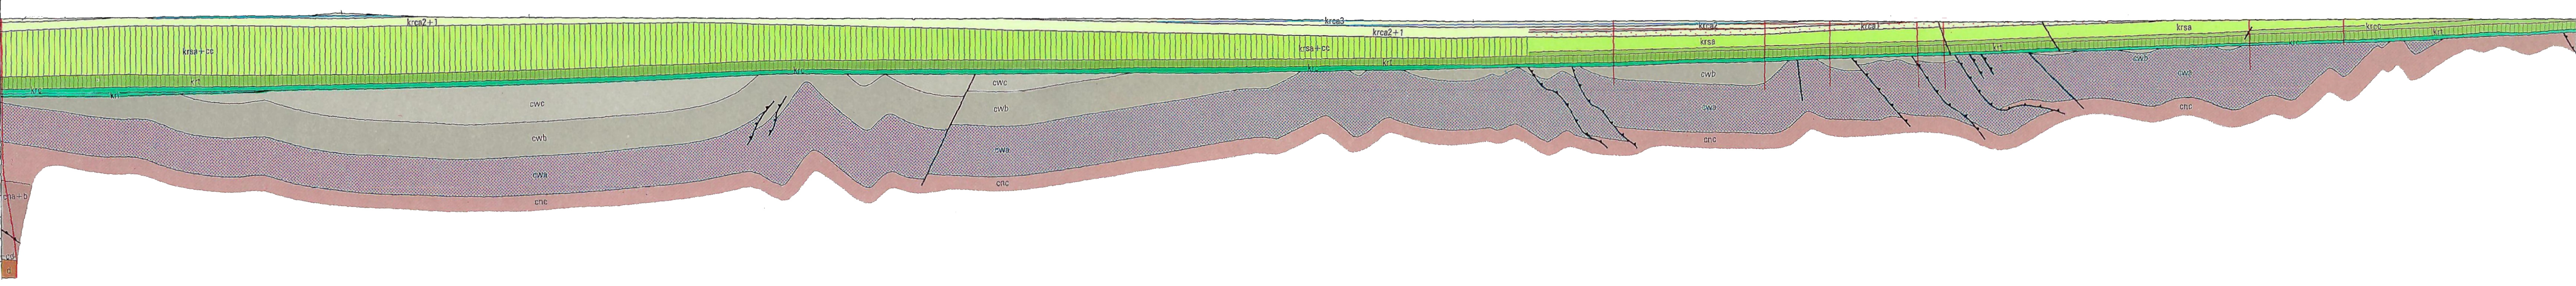
Geological Cross Section#
From these maps, the geological cross sections were extracted with an image editing software, tilted so that they are completely horizontal and cropped to the extent of the cross section. The axes were also cut off.

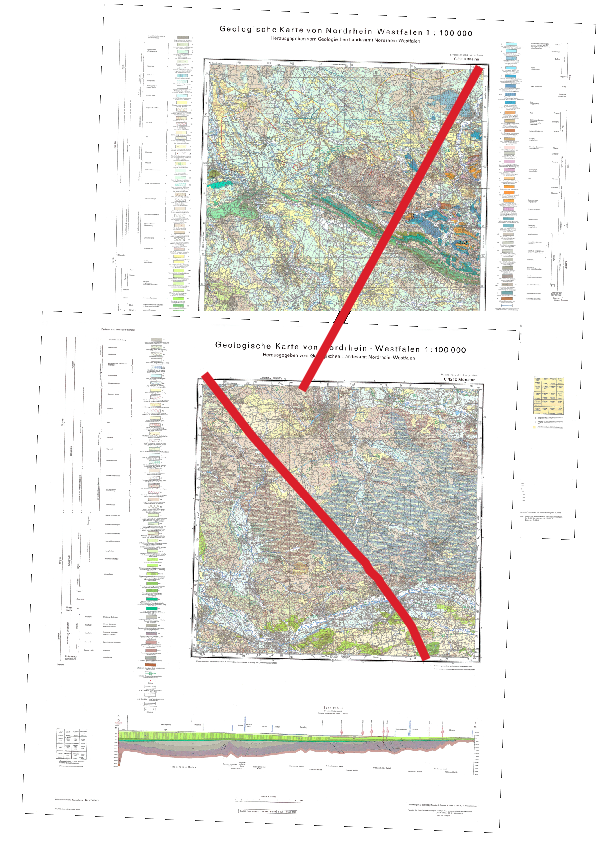
Traces of Geological Cross Sections#
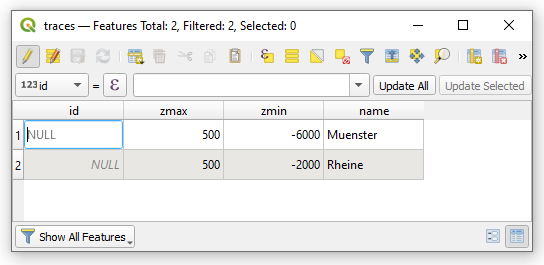
In order to locate the cross sections in space, the traces of the profiles need to be digitized and the vertical ranges of the cross sections need to be provided as attributes of the shape file. This can be done for example in QGIS.
Set File Paths and download Tutorial Data#
If you downloaded the latest GemGIS version from the Github repository, append the path so that the package can be imported successfully. Otherwise, it is recommended to install GemGIS via pip install gemgis and import GemGIS using import gemgis as gg. In addition, the file path to the folder where the data is being stored is set. The tutorial data is downloaded using Pooch (https://www.fatiando.org/pooch/latest/index.html) and stored in the specified folder. Use
pip install pooch if Pooch is not installed on your system yet.
[1]:
import gemgis as gg

file_path ='data/12_visualizing_cross_sections_in_pyvista/'
C:\Users\ale93371\Anaconda3\envs\pygeomechanical\lib\site-packages\numpy\_distributor_init.py:30: UserWarning: loaded more than 1 DLL from .libs:
C:\Users\ale93371\Anaconda3\envs\pygeomechanical\lib\site-packages\numpy\.libs\libopenblas.FB5AE2TYXYH2IJRDKGDGQ3XBKLKTF43H.gfortran-win_amd64.dll
C:\Users\ale93371\Anaconda3\envs\pygeomechanical\lib\site-packages\numpy\.libs\libopenblas64__v0.3.23-246-g3d31191b-gcc_10_3_0.dll
  warnings.warn("loaded more than 1 DLL from .libs:"
[2]:
gg.download_gemgis_data.download_tutorial_data(filename="12_visualizing_cross_sections_in_pyvista.zip", dirpath=file_path)
Downloading file '12_visualizing_cross_sections_in_pyvista.zip' from 'https://rwth-aachen.sciebo.de/s/AfXRsZywYDbUF34/download?path=%2F/12_visualizing_cross_sections_in_pyvista.zip' to 'C:\Users\ale93371\Documents\gemgis1\docs\getting_started\tutorial\data\12_visualizing_cross_sections_in_pyvista'.
Loading Data#
The traces were saved as shape file and are now loaded as GeoDataFrame using GeoPandas.
[3]:
import geopandas as gpd

traces = gpd.read_file(file_path + 'traces.shp')
traces
[3]:
| id | zmax | zmin | name | geometry | |
|---|---|---|---|---|---|
| 0 | NaN | 500 | -6000 | Muenster | LINESTRING (32386148.890 5763304.720, 32393549... |
| 1 | NaN | 500 | -2000 | Rheine | LINESTRING (32402275.136 5761828.501, 32431165... |
Create Mesh for one cross section#
A mesh can be created based on the LineStrings and the provided vertical extent using the function create_mesh_cross_section(..).
[30]:
mesh = gg.visualization.create_mesh_from_cross_section(linestring=traces.loc[0].geometry,
                                                       zmin=traces.loc[0]['zmin'],
                                                       zmax=traces.loc[0]['zmax'])

mesh
[30]:
| PolyData | Information |
|---|---|
| N Cells | 20 |
| N Points | 22 |
| N Strips | 0 |
| X Bounds | 3.239e+07, 3.242e+07 |
| Y Bounds | 5.717e+06, 5.763e+06 |
| Z Bounds | -6.000e+03, 5.000e+02 |
| N Arrays | 0 |
[31]:
type(mesh)
[31]:
pyvista.core.pointset.PolyData
Plotting Mesh#
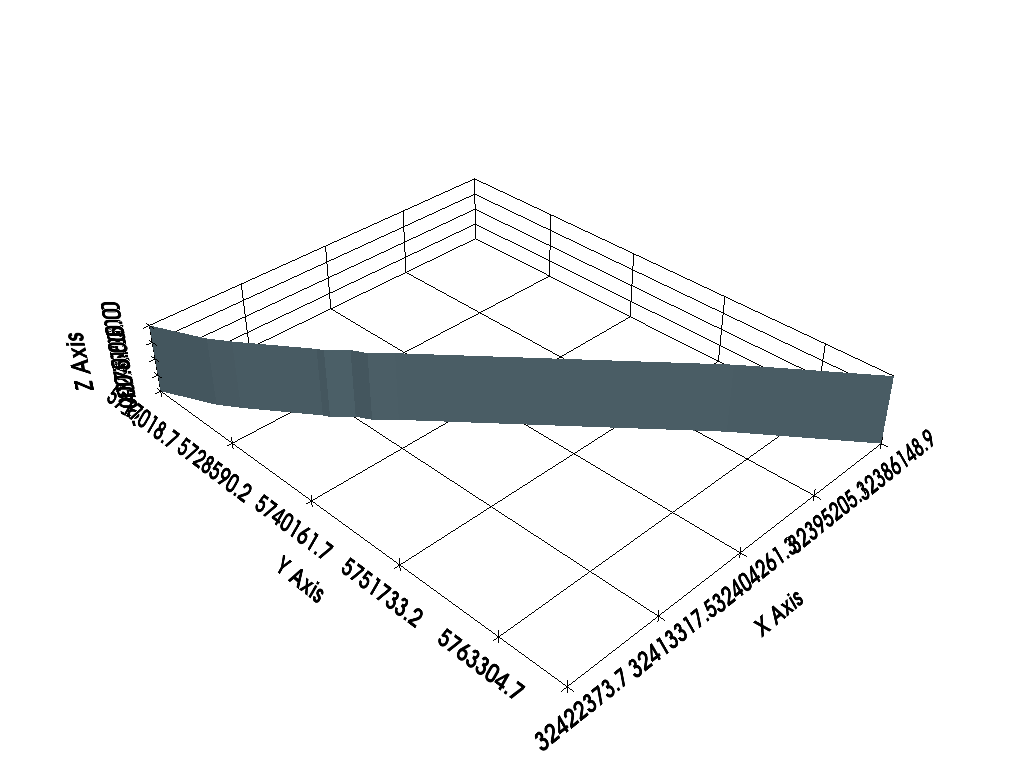
The mesh can now be plotted using PyVista. A new PyVista plotter is created. The cross section is correctly placed in space. However, no cross section data is yet shown on the mesh.
[32]:
import pyvista as pv

p = pv.Plotter()

p.add_mesh(mesh)

p.show_grid(color='black')
p.set_background(color='white')
p.show()
C:\Users\ale93371\Anaconda3\envs\pygeomechanical\lib\site-packages\pyvista\jupyter\notebook.py:58: UserWarning: Failed to use notebook backend:

No module named 'trame'

Falling back to a static output.
  warnings.warn(
Adding texture to mesh#
A texture can be applied to the mesh to display the cross section data. In this case, the image data of the cross section is used to drape it over the mesh.
[33]:
import rasterio

texture = rasterio.open(file_path + 'profile1.png')
C:\Users\ale93371\Anaconda3\envs\pygeomechanical\lib\site-packages\rasterio\__init__.py:304: NotGeoreferencedWarning: Dataset has no geotransform, gcps, or rpcs. The identity matrix will be returned.
  dataset = DatasetReader(path, driver=driver, sharing=sharing, **kwargs)
Plotting texture#
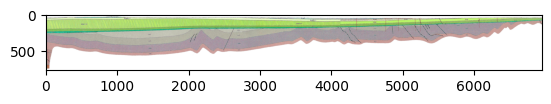
The loaded image file contains the data of the cross section.
[34]:
from rasterio.plot import show

show(texture);
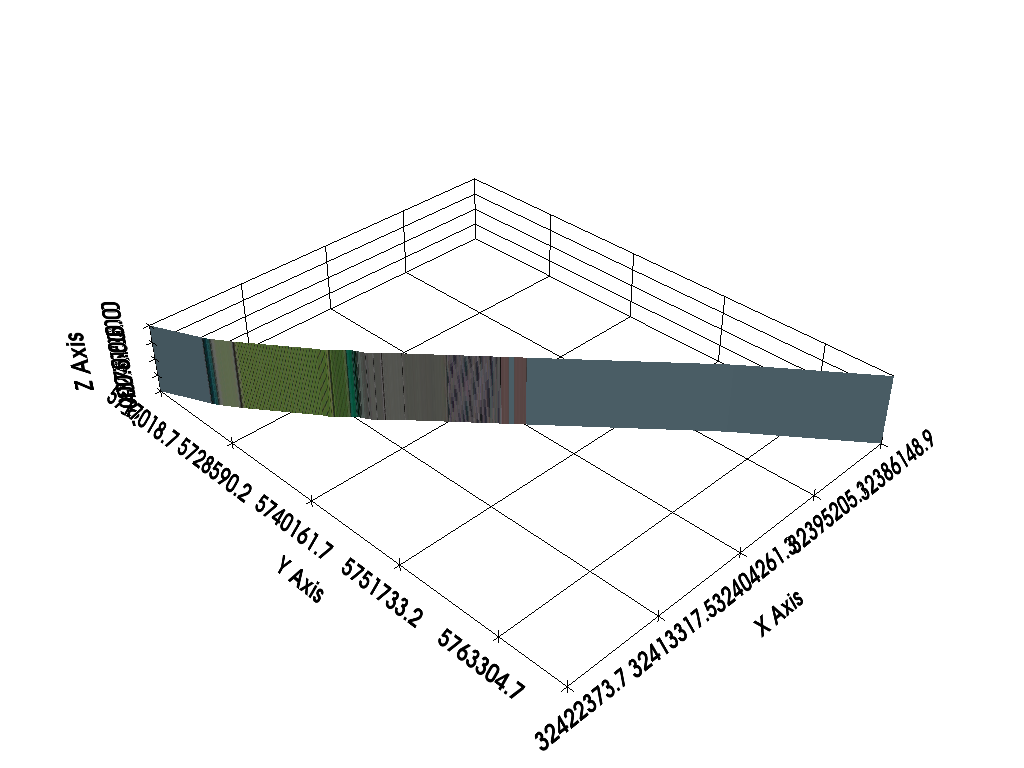
Adding texture to mesh#
A PyVista texture will be created and passed to the add_mesh(...) function as shown below to drape the image data over the mesh.
[42]:
tex = pv.read_texture(file_path + 'profile1.png')

mesh.texture_map_to_plane(use_bounds=False,inplace=True)

p = pv.Plotter()
p.add_mesh(mesh)
p.add_mesh(mesh, texture=tex)


p.show_grid(color='black')
p.set_background(color='white')
p.show()
C:\Users\ale93371\Anaconda3\envs\pygeomechanical\lib\site-packages\pyvista\jupyter\notebook.py:58: UserWarning: Failed to use notebook backend:

No module named 'trame'

Falling back to a static output.
  warnings.warn(
Creating Meshes for multiple cross sections#
The functionality for one cross section can be extended to multiple cross sections. In this case, we are passing the entire GeoDataFrame containing the traces to the function create_meshes_from_cross_sections(..). The result is a list of PyVista PolyData datasets.
[36]:
meshes = gg.visualization.create_meshes_from_cross_sections(gdf=traces)
meshes
[36]:
[PolyData (0x2cc1fb393c0)
   N Cells:    20
   N Points:   22
   N Strips:   0
   X Bounds:   3.239e+07, 3.242e+07
   Y Bounds:   5.717e+06, 5.763e+06
   Z Bounds:   -6.000e+03, 5.000e+02
   N Arrays:   0,
 PolyData (0x2cc1fb39540)
   N Cells:    2
   N Points:   4
   N Strips:   0
   X Bounds:   3.240e+07, 3.243e+07
   Y Bounds:   5.762e+06, 5.814e+06
   Z Bounds:   -2.000e+03, 5.000e+02
   N Arrays:   0]
Plotting Meshes#
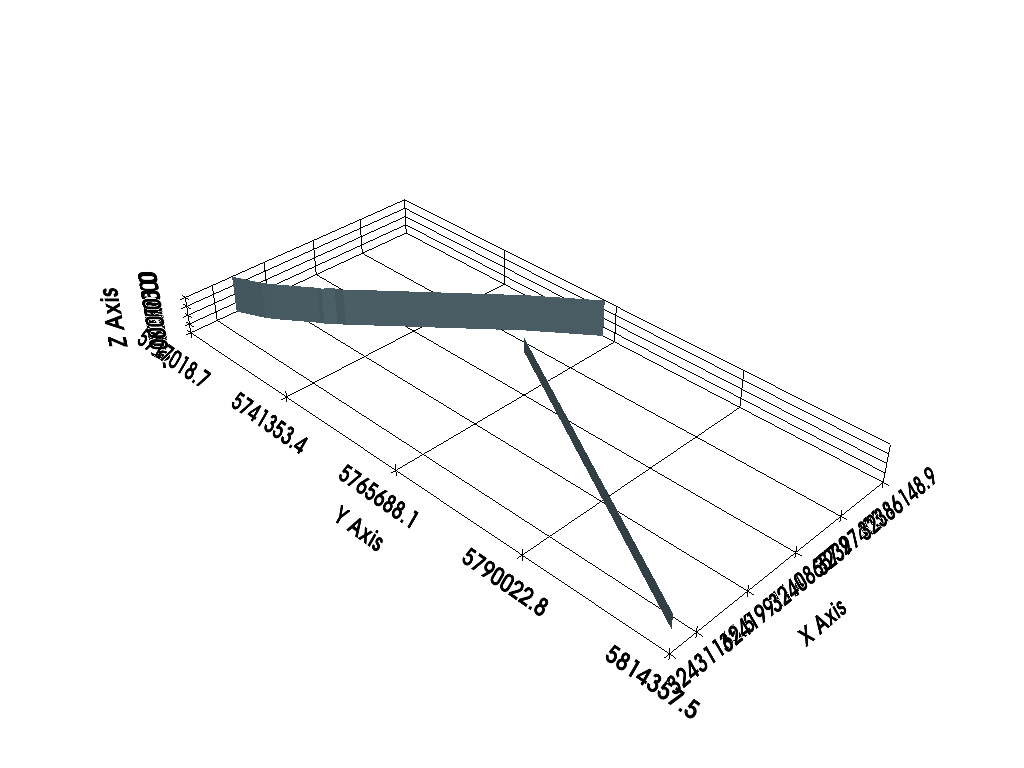
The meshes can now be plotted using PyVista. A new PyVista plotter is created. The cross sections are correctly placed in space.
[37]:
import pyvista as pv

p = pv.Plotter()

for i in range(len(meshes)):
    p.add_mesh(meshes[i])

p.show_grid(color='black')
p.set_background(color='white')
p.show()
C:\Users\ale93371\Anaconda3\envs\pygeomechanical\lib\site-packages\pyvista\jupyter\notebook.py:58: UserWarning: Failed to use notebook backend:

No module named 'trame'

Falling back to a static output.
  warnings.warn(
Adding Texture to Meshes#
As for the previous example, the textures are loaded via the path of the image files. Therefore, the function create_file_paths is used to create a list of file paths.
NB: The order of the traces in the passed GeoDataFrame must be identical to the order of the loaded images!
[38]:
source_files = gg.raster.create_filepaths(dirpath = file_path, search_criteria='profile*.png')
source_files
[38]:
['C:\\Users\\ale93371\\Documents\\gemgis1\\docs\\getting_started\\tutorial\\data\\12_visualizing_cross_sections_in_pyvista\\profile1.png',
 'C:\\Users\\ale93371\\Documents\\gemgis1\\docs\\getting_started\\tutorial\\data\\12_visualizing_cross_sections_in_pyvista\\profile2.png']
A list of textures is then created from each source image file.
[39]:
textures = [pv.Texture(file) for file in source_files]
textures
[39]:
[Texture (0x2cb84f9da80)
   Components:   4
   Cube Map:     False
   Dimensions:   6952, 771,
 Texture (0x2cc1fb3a2c0)
   Components:   4
   Cube Map:     False
   Dimensions:   7047, 293]
Plotting Meshes with Textures#
The cross sections are finally plotted at their true locations in space with the textures draped over them.
[40]:
import pyvista as pv

p = pv.Plotter()

for i in range(len(meshes)):
    p.add_mesh(meshes[i], texture=textures[i])

p.show_grid(color='black')
p.set_background(color='white')
p.show()
---------------------------------------------------------------------------
ValueError                                Traceback (most recent call last)
Cell In[40], line 6
      3 p = pv.Plotter()
      5 for i in range(len(meshes)):
----> 6     p.add_mesh(meshes[i], texture=textures[i])
      8 p.show_grid(color='black')
      9 p.set_background(color='white')

File ~\Anaconda3\envs\pygeomechanical\lib\site-packages\pyvista\plotting\plotter.py:3450, in BasePlotter.add_mesh(self, mesh, color, style, scalars, clim, show_edges, edge_color, point_size, line_width, opacity, flip_scalars, lighting, n_colors, interpolate_before_map, cmap, label, reset_camera, scalar_bar_args, show_scalar_bar, multi_colors, name, texture, render_points_as_spheres, render_lines_as_tubes, smooth_shading, split_sharp_edges, ambient, diffuse, specular, specular_power, nan_color, nan_opacity, culling, rgb, categories, silhouette, use_transparency, below_color, above_color, annotations, pickable, preference, log_scale, pbr, metallic, roughness, render, component, emissive, copy_mesh, backface_params, show_vertices, **kwargs)
   3448     raise TypeError(f'Invalid texture type ({type(texture)})')
   3449 if mesh.GetPointData().GetTCoords() is None:
-> 3450     raise ValueError(
   3451         'Input mesh does not have texture coordinates to support the texture.'
   3452     )
   3453 actor.texture = texture
   3454 # Set color to white by default when using a texture

ValueError: Input mesh does not have texture coordinates to support the texture.
[ ]: