09 Raster Operations in GemGIS
Contents
09 Raster Operations in GemGIS#
Several smaller raster operations needed for the functionality of GemGIS are implemented. This includes calculating the difference of arrays and rasterio objects (calculate_difference).
Set File Paths and download Tutorial Data#
If you downloaded the latest GemGIS version from the Github repository, append the path so that the package can be imported successfully. Otherwise, it is recommended to install GemGIS via pip install gemgis and import GemGIS using import gemgis as gg. In addition, the file path to the folder where the data is being stored is set. The tutorial data is downloaded using Pooch (https://www.fatiando.org/pooch/latest/index.html) and stored in the specified folder. Use
pip install pooch if Pooch is not installed on your system yet.
[1]:
import gemgis as gg

file_path ='data/09_raster_operations_gemgis/'
[2]:
gg.download_gemgis_data.download_tutorial_data(filename="09_raster_operations_gemgis.zip", dirpath=file_path)
Downloading file '09_raster_operations_gemgis.zip' from 'https://rwth-aachen.sciebo.de/s/AfXRsZywYDbUF34/download?path=%2F09_raster_operations_gemgis.zip' to 'C:\Users\ale93371\Documents\gemgis\docs\getting_started\tutorial\data\09_raster_operations_gemgis'.
Loading the raster data#
The rasters to perform the raster operations are being loaded with rasterio and NumPy.
[3]:
import rasterio
import numpy as np

array = np.load(file_path + 'array.npy')

raster1 = rasterio.open(file_path + 'raster.tif')
raster2 = rasterio.open(file_path + 'raster.tif')
Calculating Differences#
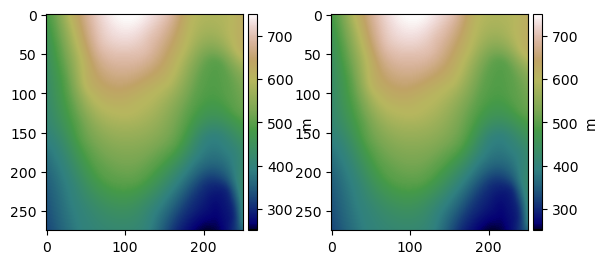
Plotting Raster Data#
As the loaded rasters are identical, the same figures are plotted.
[4]:
import matplotlib.pyplot as plt
from mpl_toolkits.axes_grid1 import make_axes_locatable

fig, (ax1, ax2) = plt.subplots(1,2)
plt.subplots_adjust(wspace=0.35)

im1 = ax1.imshow(raster1.read(1), cmap='gist_earth', vmin=250, vmax=750)
divider = make_axes_locatable(ax1)
cax = divider.append_axes("right", size="5%", pad=0.05)
cbar = plt.colorbar(im1, cax=cax)
cbar.set_label('m')


im2 = ax2.imshow(raster2.read(1), cmap='gist_earth', vmin=250, vmax=750)
divider = make_axes_locatable(ax2)
cax = divider.append_axes("right", size="5%", pad=0.05)
cbar = plt.colorbar(im2, cax=cax)
cbar.set_label('m')
Calculate difference between rasterio objects#
The difference between two rasterio objects can easily be calculated using the function calculate_difference. The result will be an array. In this case, the result is zero as the arrays are identical.
[5]:
diff = gg.raster.calculate_difference(raster1=raster1,
                                      raster2=raster2)
diff
[5]:
array([[[0., 0., 0., ..., 0., 0., 0.],
        [0., 0., 0., ..., 0., 0., 0.],
        [0., 0., 0., ..., 0., 0., 0.],
        ...,
        [0., 0., 0., ..., 0., 0., 0.],
        [0., 0., 0., ..., 0., 0., 0.],
        [0., 0., 0., ..., 0., 0., 0.]]], dtype=float32)
Calculate difference between arrays of the same size#
The difference between two arrays with the same size can easily be calculated using the function calculate_difference. The result will be an array. In this case, the result is not zero as 10 meters were subtracted from the second raster.
[6]:
diff = gg.raster.calculate_difference(raster1=raster1.read(1),
                                      raster2=raster2.read(1)-10)
diff
[6]:
array([[10., 10., 10., ..., 10., 10., 10.],
       [10., 10., 10., ..., 10., 10., 10.],
       [10., 10., 10., ..., 10., 10., 10.],
       ...,
       [10., 10., 10., ..., 10., 10., 10.],
       [10., 10., 10., ..., 10., 10., 10.],
       [10., 10., 10., ..., 10., 10., 10.]], dtype=float32)
Calculate difference of arrays of different size#
The difference between two arrays that do not have the same size can easily be calculated using the function calculate_difference. The result will be an array. In this case, the result is not zero.
Printing the shapes of the arrays.
[7]:
print(array.shape)
(1069, 972)
[8]:
print(raster1.shape)
(275, 250)
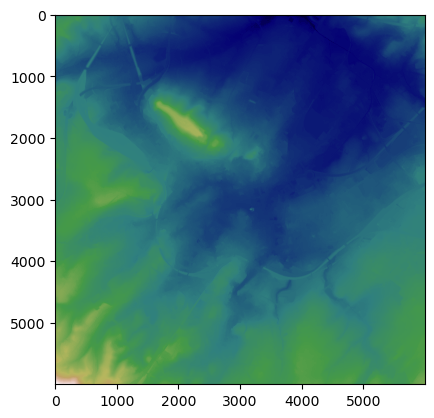
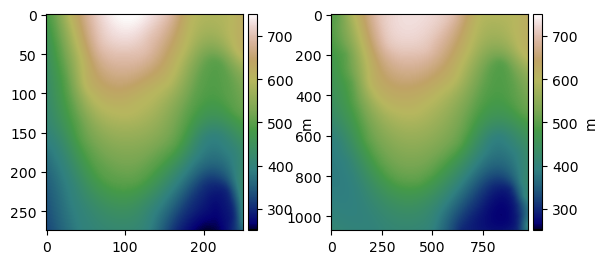
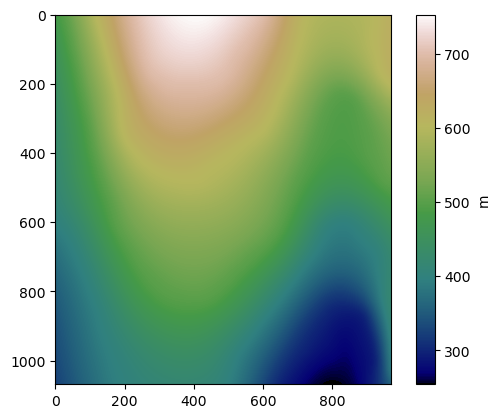
Plotting the arrays.
[9]:
import matplotlib.pyplot as plt
from mpl_toolkits.axes_grid1 import make_axes_locatable

fig, (ax1, ax2) = plt.subplots(1,2)
plt.subplots_adjust(wspace=0.35)

im1 = ax1.imshow(raster1.read(1), cmap='gist_earth', vmin=250, vmax=750)
divider = make_axes_locatable(ax1)
cax = divider.append_axes("right", size="5%", pad=0.05)
cbar = plt.colorbar(im1, cax=cax)
cbar.set_label('m')


im2 = ax2.imshow(np.flipud(array), cmap='gist_earth', vmin=250, vmax=750)
divider = make_axes_locatable(ax2)
cax = divider.append_axes("right", size="5%", pad=0.05)
cbar = plt.colorbar(im2, cax=cax)
cbar.set_label('m')
Calculating the difference. The array is turned so that the right values are substracted from the original raster.
[10]:
diff = gg.raster.calculate_difference(raster1=raster1.read(1),
                                      raster2=array,
                                      flip_array=True)

diff
[10]:
array([[-16.41678396, -13.61172709, -10.87035877, ...,  -3.19775272,
         -3.22781911,  -3.10479498],
       [-16.47500144, -13.72951014, -11.06531114, ...,  -2.5296072 ,
         -2.54858561,  -2.41534018],
       [-16.65319032, -13.99706557, -11.45171536, ...,  -1.86637421,
         -1.8699199 ,  -1.72295418],
       ...,
       [-84.66600704, -82.48561266, -80.28644375, ..., -22.60844144,
        -22.88386594, -22.15305095],
       [-85.70802569, -83.51980015, -81.31276338, ..., -23.11606161,
        -23.39106379, -22.70976508],
       [-86.71828282, -84.52284361, -82.30832183, ..., -23.66986812,
        -23.95510436, -23.32702576]])
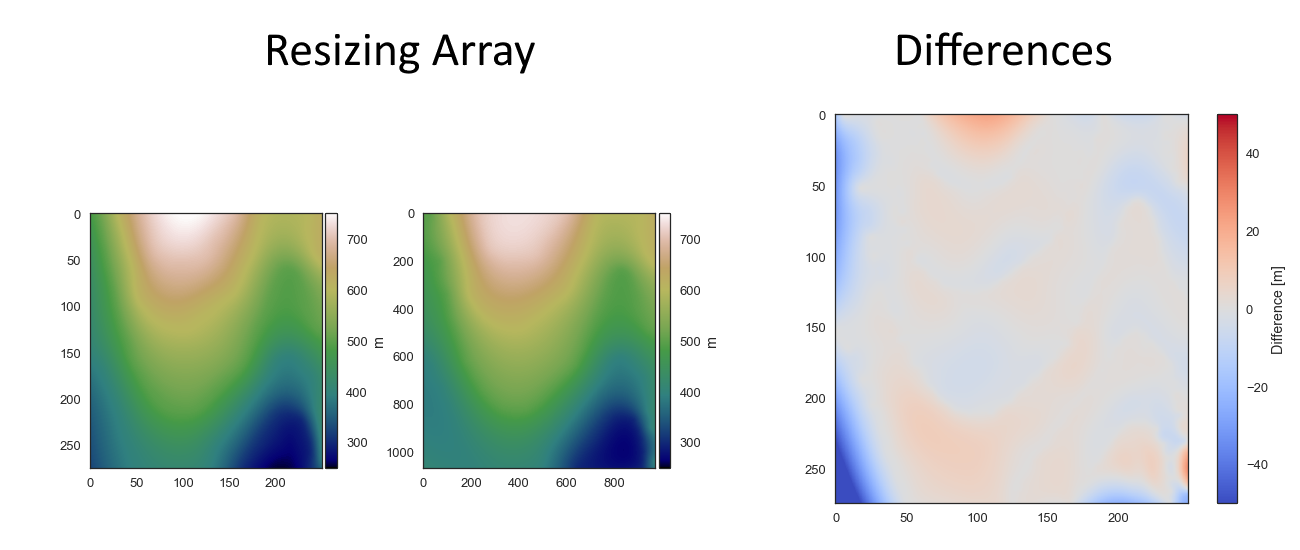
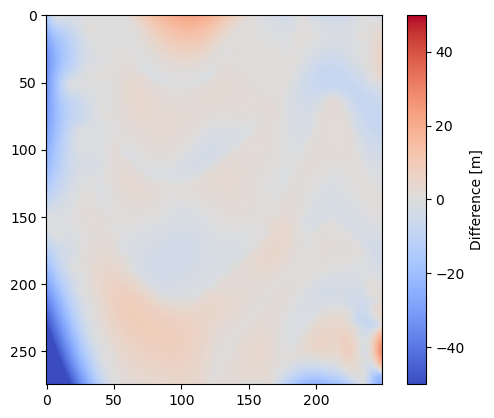
Plotting the difference. The difference is caused by a different interpolation algorithm that was used to create the array.
[11]:
im = plt.imshow(diff, cmap='coolwarm', vmin=-50, vmax=50)
cbar = plt.colorbar(im)
cbar.set_label('Difference [m]')
Resizing a raster by extent#
We can easily resize an array by providing a width and height for the returning array.
[12]:
array_resized = gg.raster.resize_raster(raster=raster1,
                                        width=972,
                                        height=1069)
array_resized.shape
[12]:
(1069, 972)
Plotting the new array.
[13]:
im = plt.imshow(array_resized, cmap='gist_earth')
cbar = plt.colorbar(im)
cbar.set_label('m')
Resize raster by array#
A raster can also be resized to fit the size of another array.
Printing the shapes of the arrays.
[14]:
print(raster1.shape)
(275, 250)
[15]:
print(array.shape)
(1069, 972)
Resizing the raster to the size of the array.
[16]:
array_resized = gg.raster.resize_by_array(raster=raster1,
                                          array=array)

print(array_resized.shape)
(1069, 972)
[17]:
im = plt.imshow(array_resized, cmap='gist_earth')
cbar = plt.colorbar(im)
cbar.set_label('m')

Saving array as tiff#
Arrays can easily be saved as rasters using save_as_tiff.
[18]:
gg.raster.save_as_tiff(raster=array,
                       path= file_path + 'output_raster.tif',
                       extent=[0,972,0,1069],
                       crs='EPSG:4326',
                       overwrite_file=True)
Raster successfully saved
Merging rasters#
Several different rasterio objects/raster files can be merged using the merge_tiles(..) function. Before that, a list of file paths and and a list of loaded rasterio objects needs to be created first.
Rasters downloaded from https://www.tim-online.nrw.de/tim-online2/
Creating List of Filepaths#
A list of filepaths with all raster files can be created using create_filepaths(..).
[19]:
paths = gg.raster.create_filepaths(dirpath=file_path, search_criteria = 'tile*')
paths
[19]:
['C:\\Users\\ale93371\\Documents\\gemgis\\docs\\getting_started\\tutorial\\data\\09_raster_operations_gemgis\\tile_292000_294000_5626000_5628000.tif',
 'C:\\Users\\ale93371\\Documents\\gemgis\\docs\\getting_started\\tutorial\\data\\09_raster_operations_gemgis\\tile_292000_294000_5628000_5630000.tif',
 'C:\\Users\\ale93371\\Documents\\gemgis\\docs\\getting_started\\tutorial\\data\\09_raster_operations_gemgis\\tile_292000_294000_5630000_5632000.tif',
 'C:\\Users\\ale93371\\Documents\\gemgis\\docs\\getting_started\\tutorial\\data\\09_raster_operations_gemgis\\tile_294000_296000_5626000_5628000.tif',
 'C:\\Users\\ale93371\\Documents\\gemgis\\docs\\getting_started\\tutorial\\data\\09_raster_operations_gemgis\\tile_294000_296000_5628000_5630000.tif',
 'C:\\Users\\ale93371\\Documents\\gemgis\\docs\\getting_started\\tutorial\\data\\09_raster_operations_gemgis\\tile_294000_296000_5630000_5632000.tif',
 'C:\\Users\\ale93371\\Documents\\gemgis\\docs\\getting_started\\tutorial\\data\\09_raster_operations_gemgis\\tile_296000_298000_5626000_5628000.tif',
 'C:\\Users\\ale93371\\Documents\\gemgis\\docs\\getting_started\\tutorial\\data\\09_raster_operations_gemgis\\tile_296000_298000_5628000_5630000.tif',
 'C:\\Users\\ale93371\\Documents\\gemgis\\docs\\getting_started\\tutorial\\data\\09_raster_operations_gemgis\\tile_296000_298000_5630000_5632000.tif']
Creating List of Rasterio Objects#
[20]:
raster_objects = gg.raster.create_src_list(dirpath=file_path, search_criteria = 'tile*')
raster_objects
[20]:
[<open DatasetReader name='C:/Users/ale93371/Documents/gemgis/docs/getting_started/tutorial/data/09_raster_operations_gemgis/tile_292000_294000_5626000_5628000.tif' mode='r'>,
 <open DatasetReader name='C:/Users/ale93371/Documents/gemgis/docs/getting_started/tutorial/data/09_raster_operations_gemgis/tile_292000_294000_5628000_5630000.tif' mode='r'>,
 <open DatasetReader name='C:/Users/ale93371/Documents/gemgis/docs/getting_started/tutorial/data/09_raster_operations_gemgis/tile_292000_294000_5630000_5632000.tif' mode='r'>,
 <open DatasetReader name='C:/Users/ale93371/Documents/gemgis/docs/getting_started/tutorial/data/09_raster_operations_gemgis/tile_294000_296000_5626000_5628000.tif' mode='r'>,
 <open DatasetReader name='C:/Users/ale93371/Documents/gemgis/docs/getting_started/tutorial/data/09_raster_operations_gemgis/tile_294000_296000_5628000_5630000.tif' mode='r'>,
 <open DatasetReader name='C:/Users/ale93371/Documents/gemgis/docs/getting_started/tutorial/data/09_raster_operations_gemgis/tile_294000_296000_5630000_5632000.tif' mode='r'>,
 <open DatasetReader name='C:/Users/ale93371/Documents/gemgis/docs/getting_started/tutorial/data/09_raster_operations_gemgis/tile_296000_298000_5626000_5628000.tif' mode='r'>,
 <open DatasetReader name='C:/Users/ale93371/Documents/gemgis/docs/getting_started/tutorial/data/09_raster_operations_gemgis/tile_296000_298000_5628000_5630000.tif' mode='r'>,
 <open DatasetReader name='C:/Users/ale93371/Documents/gemgis/docs/getting_started/tutorial/data/09_raster_operations_gemgis/tile_296000_298000_5630000_5632000.tif' mode='r'>]
[21]:
raster_objects = gg.raster.create_src_list(filepaths=paths)
raster_objects
[21]:
[<open DatasetReader name='C:/Users/ale93371/Documents/gemgis/docs/getting_started/tutorial/data/09_raster_operations_gemgis/tile_292000_294000_5626000_5628000.tif' mode='r'>,
 <open DatasetReader name='C:/Users/ale93371/Documents/gemgis/docs/getting_started/tutorial/data/09_raster_operations_gemgis/tile_292000_294000_5628000_5630000.tif' mode='r'>,
 <open DatasetReader name='C:/Users/ale93371/Documents/gemgis/docs/getting_started/tutorial/data/09_raster_operations_gemgis/tile_292000_294000_5630000_5632000.tif' mode='r'>,
 <open DatasetReader name='C:/Users/ale93371/Documents/gemgis/docs/getting_started/tutorial/data/09_raster_operations_gemgis/tile_294000_296000_5626000_5628000.tif' mode='r'>,
 <open DatasetReader name='C:/Users/ale93371/Documents/gemgis/docs/getting_started/tutorial/data/09_raster_operations_gemgis/tile_294000_296000_5628000_5630000.tif' mode='r'>,
 <open DatasetReader name='C:/Users/ale93371/Documents/gemgis/docs/getting_started/tutorial/data/09_raster_operations_gemgis/tile_294000_296000_5630000_5632000.tif' mode='r'>,
 <open DatasetReader name='C:/Users/ale93371/Documents/gemgis/docs/getting_started/tutorial/data/09_raster_operations_gemgis/tile_296000_298000_5626000_5628000.tif' mode='r'>,
 <open DatasetReader name='C:/Users/ale93371/Documents/gemgis/docs/getting_started/tutorial/data/09_raster_operations_gemgis/tile_296000_298000_5628000_5630000.tif' mode='r'>,
 <open DatasetReader name='C:/Users/ale93371/Documents/gemgis/docs/getting_started/tutorial/data/09_raster_operations_gemgis/tile_296000_298000_5630000_5632000.tif' mode='r'>]
Merging Rasters#
The loaded list of rasters can now be merged using merge_tiles(..). The result will the array that is created and the transform associated with the array.
[22]:
mosaic, transform = gg.raster.merge_tiles(src_files=raster_objects)
[23]:
type(mosaic)
[23]:
numpy.ndarray
[24]:
type(transform)
[24]:
affine.Affine
[25]:
mosaic
[25]:
array([[200.72, 200.73, 200.72, ..., 204.42, 204.45, 204.45],
       [200.74, 200.74, 200.75, ..., 204.43, 204.44, 204.48],
       [200.76, 200.76, 200.76, ..., 204.42, 204.48, 204.5 ],
       ...,
       [329.15, 328.86, 328.74, ..., 242.45, 242.38, 242.28],
       [329.29, 329.06, 328.87, ..., 242.45, 242.39, 242.31],
       [329.47, 329.3 , 329.09, ..., 242.42, 242.37, 242.32]],
      dtype=float32)
[26]:
transform
[26]:
Affine(1.0, 0.0, 292000.0,
       0.0, -1.0, 5632000.0)
[27]:
plt.imshow(mosaic, cmap='gist_earth')
[27]:
<matplotlib.image.AxesImage at 0x29685b71cf0>