11 Removing Interface Points within Fault Buffers
Contents
11 Removing Interface Points within Fault Buffers#
The following will present how vertices of LineStrings stored as GeoDataFrames can be removed if they share the same points with the trace of a fault. The LineStrings in questions usually represent layer boundaries on geological maps. If vertices of these boundaries are sharing the same coordinates as the fault vertices, the interpolation in GemPyor a subsequent uncertainty analysis may not work properly.
Source: Geological Map 1:50,000, Geological Survey NRW
Set File Paths and download Tutorial Data#
If you downloaded the latest GemGIS version from the Github repository, append the path so that the package can be imported successfully. Otherwise, it is recommended to install GemGIS via pip install gemgis and import GemGIS using import gemgis as gg. In addition, the file path to the folder where the data is being stored is set. The tutorial data is downloaded using Pooch (https://www.fatiando.org/pooch/latest/index.html) and stored in the specified folder. Use
pip install pooch if Pooch is not installed on your system yet.
[1]:
import gemgis as gg

file_path ='data/11_removing_interfaces_within_fault_buffers/'
[2]:
gg.download_gemgis_data.download_tutorial_data(filename="11_removing_interfaces_within_fault_buffers.zip", dirpath=file_path)
Downloading file '11_removing_interfaces_within_fault_buffers.zip' from 'https://rwth-aachen.sciebo.de/s/AfXRsZywYDbUF34/download?path=%2F11_removing_interfaces_within_fault_buffers.zip' to 'C:\Users\ale93371\Documents\gemgis\docs\getting_started\tutorial\data\11_removing_interfaces_within_fault_buffers'.
Loading Interface points and fault data#
For this tutorial, we are using layer boundaries and fault traces from the Aachen area, Germany. Both data sets are saved as shape files and will be loaded with GeoPandas. The interface data is saved as a Polygon but LineStrings can be extracted from that.
The data used for GemGIS was provided by the Geological Survey NRW (GD NRW). It will be used under Datenlizenz Deutschland – Namensnennung – Version 2.0 (https://www.govdata.de/dl-de/by-2-0) with © Geowissenschaftliche Daten: IS GK 50, Projektgebiet Ballunngsraum Aachen (2020).
Loading Data#
The faults and interfaces are loaded using GeoPandas and converted to EPSG:4647.
[3]:
import geopandas as gpd

faults = gpd.read_file(file_path + 'GK50_Tektonik.shp')
faults = faults.to_crs('EPSG:4647')
faults.head()
[3]:
| ID | NAME | LEGENDE | TYP | BEDECKUNG | HYDRAULIK | AKTIVITAET | BEDEUTUNG | BEARBEITUN | AENDERUNGS | AKTUALISIE | SHAPE_Leng | geometry | |
|---|---|---|---|---|---|---|---|---|---|---|---|---|---|
| 0 | 90006 | - | Abschiebung | Abschiebung (su) | keine quartäre Bedeckung | nicht bekannt | tektonisch nicht aktiv | lokale bis regionale Bedeutung | 2010-07-29 | 2010-07-29 | 2019-09-26 | 236.48 | LINESTRING (32322728.046 5638651.481, 32322623... |
| 1 | 90185 | Aachener Überschiebung | Auf- oder Überschiebung | Aufschiebung (sa) | keine quartäre Bedeckung | hydraulisch wirksam - wasserführend | tektonisch nicht aktiv | überregionale Bedeutung | 2010-07-29 | 2010-07-29 | 2019-09-26 | 403.92 | LINESTRING (32297864.303 5632557.868, 32297856... |
| 2 | 90196 | Breinigerberg Überschiebung | Auf- oder Überschiebung | Aufschiebung (sa) | keine quartäre Bedeckung | hydraulisch wirksam - wasserführend | tektonisch nicht aktiv | lokale bis regionale Bedeutung | 2010-07-29 | 2010-07-29 | 2019-09-26 | 184.94 | LINESTRING (32300812.497 5620357.365, 32300932... |
| 3 | 90196 | Breinigerberg Überschiebung | Auf- oder Überschiebung | Aufschiebung (sa) | keine quartäre Bedeckung | hydraulisch wirksam - wasserführend | tektonisch nicht aktiv | lokale bis regionale Bedeutung | 2010-07-29 | 2010-07-29 | 2019-09-26 | 5738.56 | LINESTRING (32301454.461 5620679.837, 32301589... |
| 4 | 90196 | Breinigerberg Überschiebung | Auf- oder Überschiebung | Aufschiebung (sa) | keine quartäre Bedeckung | hydraulisch wirksam - wasserführend | tektonisch nicht aktiv | lokale bis regionale Bedeutung | 2010-07-29 | 2010-07-29 | 2019-09-26 | 713.29 | LINESTRING (32306882.447 5625319.830, 32306899... |
[4]:
interfaces = gpd.read_file(file_path + 'GeologicalMapAachen.shp')
print(interfaces.crs)
interfaces.head()
epsg:4647
[4]:
| OBJECTID | SYSTEM2 | SERIE2 | SSERIE2 | STUFE2 | SSTUFE2 | SYSTEM1 | SERIE1 | SSERIE1 | STUFE1 | ... | SGRUPPE | SSYMBOL | EINHEIT1 | EINHEIT2 | SSY_GSY | GE_GG | GRUTEXT | SHAPE_Leng | SHAPE_Area | geometry | |
|---|---|---|---|---|---|---|---|---|---|---|---|---|---|---|---|---|---|---|---|---|---|
| 0 | 131 | Devon | Oberdevon | - | Famennium | - | Devonian | Oberdevon | - | Frasnium | ... | - | dfrs+f | Frasnes- und Famenne-Schiefer | - | dfrs+f,T | 45403002130.00 | Tonstein; untergeordnet Kalkmergel- bis Mergel... | 459.12 | 12043.31 | POLYGON ((32299083.709 5631034.983, 32299164.0... |
| 1 | 132 | - | - | - | - | - | Neogene | Miozän | Obermiozän | - | ... | - | mii7 | Inden-Formation | - | mii7,s4 | 7000001110.00 | Fein- bis Mittelsand; untergeordnet Schluff un... | 4409.72 | 487296.28 | POLYGON ((32317556.700 5633860.692, 32317497.2... |
| 2 | 133 | - | - | - | - | - | Neogene | Miozän | Obermiozän | - | ... | - | mii7 | Inden-Formation | - | mii7,s4 | 7000001110.00 | Fein- bis Mittelsand; untergeordnet Schluff un... | 7644.70 | 2347096.98 | POLYGON ((32310428.554 5638385.230, 32310400.4... |
| 3 | 134 | - | - | - | - | - | Cretaceous | Oberkreide | - | Santonium | ... | - | krsah | Aachen-Formation | Aachen-Formation, Hergenrath-Subformation | krsah,ut | 17400001115.00 | Schluff und Ton; untergeordnet Fein- bis Mitte... | 19078.93 | 2340702.57 | POLYGON ((32291096.918 5622295.519, 32290989.7... |
| 4 | 135 | Devon | Oberdevon | - | Famennium | - | Devonian | Mitteldevon | - | Givetium | ... | - | dgfk | Massenkalk | - | dgfk,KD | 46800002015.00 | Kalkstein und Dolomitstein | 4615.89 | 405124.98 | POLYGON ((32307344.796 5625848.944, 32307389.6... |
5 rows × 22 columns
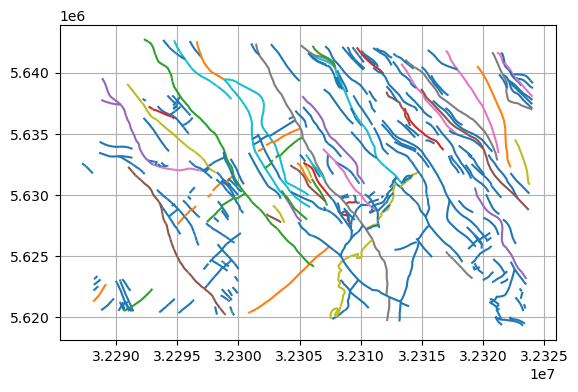
Plotting the Input Data#
The data can be plotted using the built-in GeoPandas plotting function.
[5]:
import matplotlib.pyplot as plt

fig, ax = plt.subplots(figsize=(10,10))
faults.plot(ax=ax, aspect='equal', column='NAME')
interfaces.plot(ax=ax, aspect='equal', column = 'SYSTEM1', alpha = 0.25)
plt.grid()
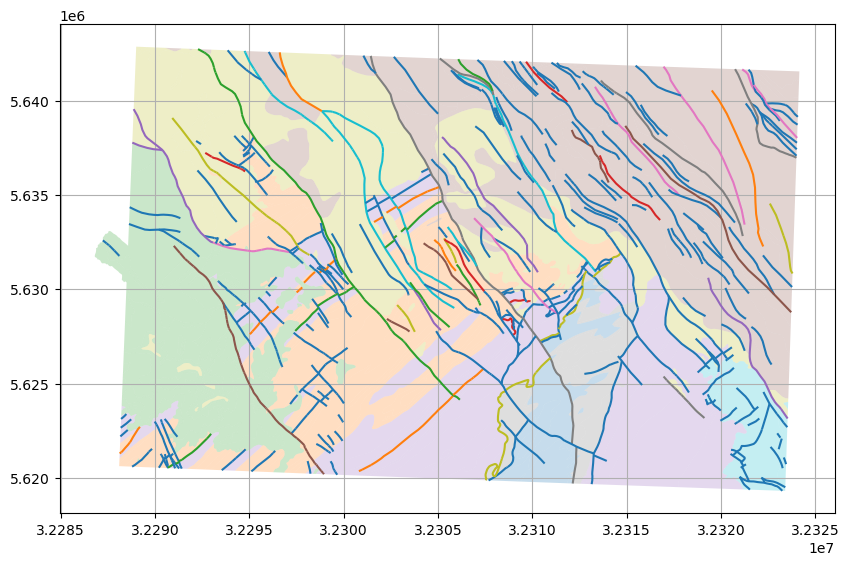
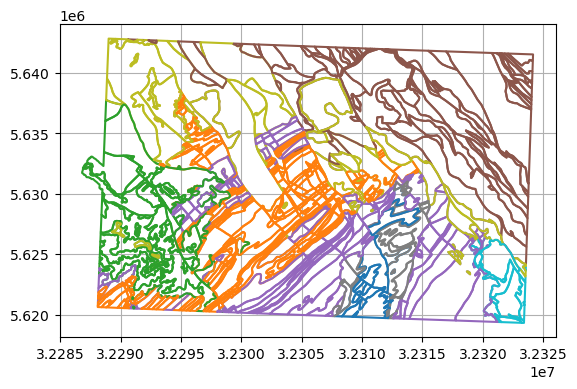
Exploding Polygons to LineStrings to show the different mapped layers.
[6]:
gg.vector.explode_polygons(interfaces).plot(column='SYSTEM1')
plt.grid()

Removing interfaces within fault buffers#
The removal of interfaces from within fault buffers consists of multiple steps:
Creating a buffer around a fault
Creating buffers for all faults
Subtracting Geometry objects from another
Removing object within buffer
Removing objects within buffer
Removing all interfaces from all faults
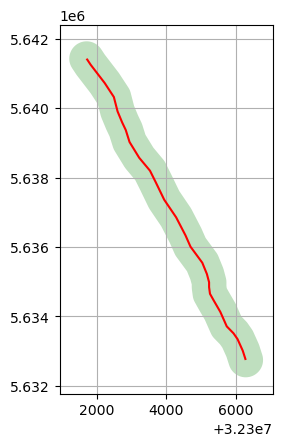
Creating a buffer around a fault#
A buffer needs to be created around a fault so that all vertices of interfaces can be deleted from this buffer. A section (782) of the Sandgewand Fault will be taken to demonstrate the feature.
Original fault LineString.
[7]:
faults.loc[782].geometry
[7]:

Buffer created around LineString.
[8]:
buffered_fault = gg.vector.create_buffer(geom_object=faults.loc[782].geometry,
                                         distance=500)
buffered_fault
[8]:

The buffer and the original LineString can also be plotted to illustrate the buffering.
[9]:
fig, ax = plt.subplots(1,1)

gpd.GeoDataFrame(geometry=[faults.loc[782].geometry]).plot(ax=ax, aspect='equal', color='red')
gpd.GeoDataFrame(geometry=[buffered_fault]).plot(ax=ax, aspect='equal', color='green', alpha=0.25)

plt.grid()
Creating Buffers around all faults#
To avoid creating too many single buffers to check whether an interface is within a buffer or not, one single buffer for all faults can be created. It will be returned as Shapely Multipolygon.
Plotting all faults in the Aachen area.
[10]:
faults.plot(aspect='equal', column='NAME')
plt.grid()
Creating a buffer of 500 m around all faults.
[11]:
polygon = gg.vector.create_unified_buffer(geom_object=faults,
                                          distance=500)

polygon
[11]:

[12]:
type(polygon)
[12]:
shapely.geometry.multipolygon.MultiPolygon
Subtracting Geometry Objects from another#
The next step is to subtract the vertices of an interface polygon, linestring or points from the fault bufffer. A layer boundary sharing vertices with the Sandgewand fault will be used for that (198). The polygons will be exploded to LineStrings and MultiLineStrings first so that no artifacts will remain.
[13]:
interfaces_ls = gg.vector.explode_polygons(gdf=interfaces)
interfaces_ls.head()
[13]:
| OBJECTID | SYSTEM2 | SERIE2 | SSERIE2 | STUFE2 | SSTUFE2 | SYSTEM1 | SERIE1 | SSERIE1 | STUFE1 | ... | SGRUPPE | SSYMBOL | EINHEIT1 | EINHEIT2 | SSY_GSY | GE_GG | GRUTEXT | SHAPE_Leng | SHAPE_Area | geometry | |
|---|---|---|---|---|---|---|---|---|---|---|---|---|---|---|---|---|---|---|---|---|---|
| 0 | 131 | Devon | Oberdevon | - | Famennium | - | Devonian | Oberdevon | - | Frasnium | ... | - | dfrs+f | Frasnes- und Famenne-Schiefer | - | dfrs+f,T | 45403002130.00 | Tonstein; untergeordnet Kalkmergel- bis Mergel... | 459.12 | 12043.31 | LINESTRING (32299083.709 5631034.983, 32299164... |
| 1 | 132 | - | - | - | - | - | Neogene | Miozän | Obermiozän | - | ... | - | mii7 | Inden-Formation | - | mii7,s4 | 7000001110.00 | Fein- bis Mittelsand; untergeordnet Schluff un... | 4409.72 | 487296.28 | LINESTRING (32317556.700 5633860.692, 32317497... |
| 2 | 133 | - | - | - | - | - | Neogene | Miozän | Obermiozän | - | ... | - | mii7 | Inden-Formation | - | mii7,s4 | 7000001110.00 | Fein- bis Mittelsand; untergeordnet Schluff un... | 7644.70 | 2347096.98 | LINESTRING (32310428.554 5638385.230, 32310400... |
| 3 | 134 | - | - | - | - | - | Cretaceous | Oberkreide | - | Santonium | ... | - | krsah | Aachen-Formation | Aachen-Formation, Hergenrath-Subformation | krsah,ut | 17400001115.00 | Schluff und Ton; untergeordnet Fein- bis Mitte... | 19078.93 | 2340702.57 | MULTILINESTRING ((32291096.918 5622295.519, 32... |
| 4 | 135 | Devon | Oberdevon | - | Famennium | - | Devonian | Mitteldevon | - | Givetium | ... | - | dgfk | Massenkalk | - | dgfk,KD | 46800002015.00 | Kalkstein und Dolomitstein | 4615.89 | 405124.98 | LINESTRING (32307344.796 5625848.944, 32307389... |
5 rows × 22 columns
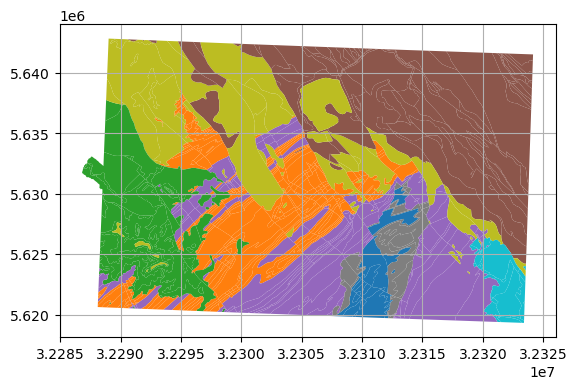
Original Polygon Data.
[14]:
interfaces.plot(column='SYSTEM1')
plt.grid()
LineStrings and MultiLineStrings after exploding the polygons.
[15]:
interfaces_ls.plot(column='SYSTEM1')
plt.grid()
LineString that will be buffered.
[16]:
interfaces_ls.loc[198].geometry
[16]:

Buffer for the LineString.
[17]:
buffered_fault
[17]:

Subtracting the geometry type from each other.
[18]:
result_geom_object = gg.vector.subtract_geom_objects(geom_object1=interfaces_ls.loc[198].geometry,
                                                     geom_object2=buffered_fault)

result_geom_object
[18]:

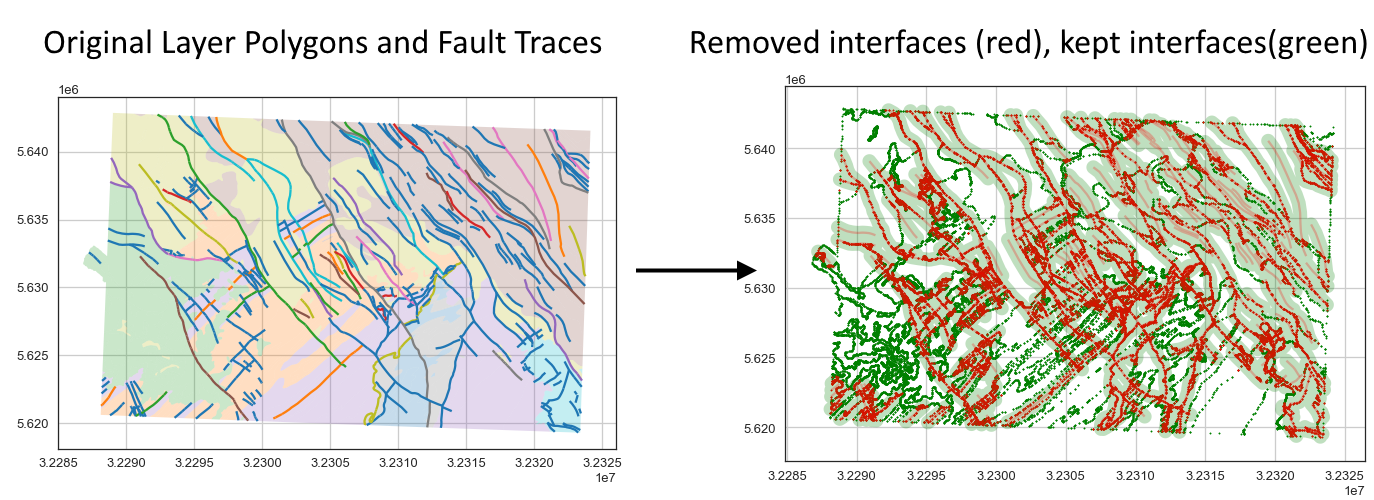
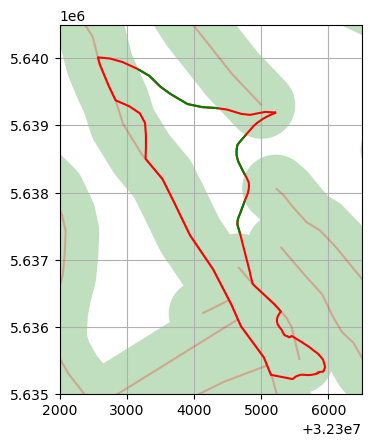
Plotting the removed interfaces (red) and the kept interfaces (green).
[19]:
fig, ax = plt.subplots(1,1)
gpd.GeoDataFrame(geometry=[interfaces_ls.loc[198].geometry]).plot(ax=ax, aspect='equal', color='red')

gpd.GeoDataFrame(geometry=[result_geom_object]).plot(ax=ax, aspect='equal', color='green')

gpd.GeoDataFrame(geometry=[buffered_fault]).plot(ax=ax, aspect='equal', color='green', alpha=0.25)
gpd.GeoDataFrame(geometry=[faults.loc[782].geometry]).plot(ax=ax, aspect='equal', color='red', alpha=0.25)

plt.grid()
Performing the subtraction for the entire fault polygon.
[20]:
result_geom_object = gg.vector.subtract_geom_objects(geom_object1=interfaces_ls.loc[198].geometry,
                                                     geom_object2=polygon)

result_geom_object
[20]:

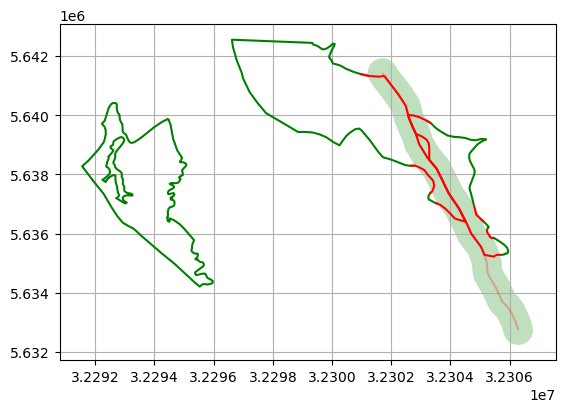
Plotting the removed interfaces (red) and the kept interfaces (green) when substracting it from the entire fault buffer polygon.
[21]:
fig, ax = plt.subplots(1,1)
gpd.GeoDataFrame(geometry=[interfaces_ls.loc[198].geometry]).plot(ax=ax, aspect='equal', color='red')

gpd.GeoDataFrame(geometry=[result_geom_object]).plot(ax=ax, aspect='equal', color='green')

gpd.GeoDataFrame(geometry=[polygon]).plot(ax=ax, aspect='equal', color='green', alpha=0.25)
faults.plot(ax=ax, aspect='equal', color='red', alpha=0.25)
plt.xlim(32302000, 32306500)
plt.ylim(5.635e6, 5.6405e6)
plt.grid()
Removing object within buffer#
The two previous steps of creating a buffer and removing the objects within the buffer can be combined in the function remove_object_within_buffer(..).
Displaying a second layer around the same fault.
[22]:
interfaces_ls.loc[374].geometry
[22]:

Buffer for the same fault as before.
[23]:
buffered_fault
[23]:

Removing the object from within the buffer.
[24]:
outside, inside = gg.vector.remove_object_within_buffer(buffer_object=faults.loc[782].geometry,
                                                           buffered_object=interfaces_ls.loc[374].geometry,
                                                           distance=500)
Interfaces that were not removed from the layer.
[25]:
outside
[25]:

Interfaces that were removed from the layer.
[26]:
inside
[26]:

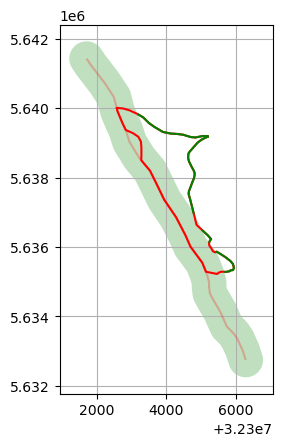
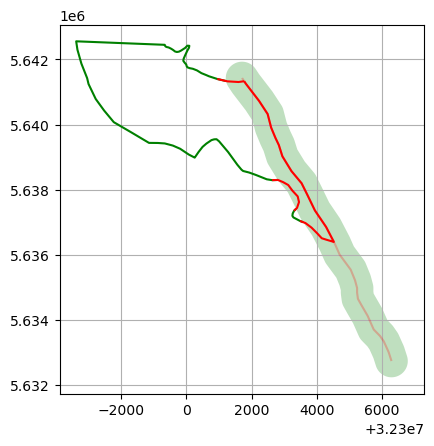
Plotting the interfaces that were removed (red) and the interfaces that were kept (green).
[27]:
fig, ax = plt.subplots(1,1)
gpd.GeoDataFrame(geometry=[outside]).plot(ax=ax, aspect='equal', color='green')

gpd.GeoDataFrame(geometry=[inside]).plot(ax=ax, aspect='equal', color='red')

gpd.GeoDataFrame(geometry=[buffered_fault]).plot(ax=ax, aspect='equal', color='green', alpha=0.25)
gpd.GeoDataFrame(geometry=[faults.loc[782].geometry]).plot(ax=ax, aspect='equal', color='red', alpha=0.25)

plt.grid()
Performing the same operation with the entire fault polygon
[28]:
outside, inside = gg.vector.remove_object_within_buffer(buffer_object=polygon,
                                                        buffered_object=interfaces_ls.loc[374].geometry,
                                                        distance=None,
                                                        buffer=False)
The resulting interfaces that are left are less than before as other faults also contributed to the buffering.
[29]:
outside
[29]:

More interfaces were removed as other faults also contributed to the buffering.
[30]:
inside
[30]:

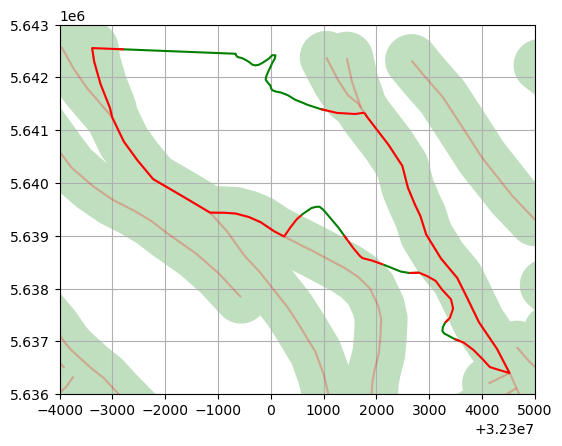
Plotting the interfaces that were removed (red) and the interfaces that were kept (green).
[31]:
fig, ax = plt.subplots(1,1)
gpd.GeoDataFrame(geometry=[outside]).plot(ax=ax, aspect='equal', color='green')

gpd.GeoDataFrame(geometry=[inside]).plot(ax=ax, aspect='equal', color='red')

gpd.GeoDataFrame(geometry=[polygon]).plot(ax=ax, aspect='equal', color='green', alpha=0.25)
faults.plot(ax=ax, aspect='equal', color='red', alpha=0.25)

plt.xlim(32296000, 32305000)
plt.ylim(5.636e6, 5.643e6)
plt.grid()
Removing objects within buffer#
The next step is to remove multiple objects from the fault buffer polygon at the same time.
Therefore, we create a GeoDataFrame with interfaces objects and use once only one fault and then all faults.
[32]:
interfaces_gdf = gpd.GeoDataFrame(geometry=[interfaces_ls.loc[374].geometry,
                                            interfaces_ls.loc[198].geometry,
                                            interfaces_ls.loc[800].geometry])
interfaces_gdf
[32]:
| geometry | |
|---|---|
| 0 | LINESTRING (32301771.153 5641329.303, 32301821... |
| 1 | LINESTRING (32305222.632 5639189.905, 32305218... |
| 2 | MULTILINESTRING ((32294465.330 5639887.282, 32... |
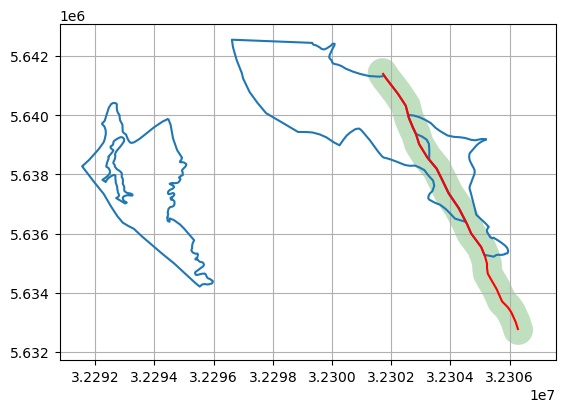
Plotting the interfaces and the fault including its buffer. Two layers are touching the fault, the third one does not.
[33]:
fig, ax = plt.subplots(1,1)

interfaces_gdf.plot(ax=ax, aspect='equal')
gpd.GeoDataFrame(geometry=[gg.vector.create_buffer(faults.loc[782].geometry, 500)]).plot(ax=ax, aspect='equal', color='green', alpha=0.25)
gpd.GeoDataFrame(geometry=[faults.loc[782].geometry]).plot(ax=ax, aspect='equal', color='red')

plt.grid()
Removing the interfaces from the fault buffer.
[34]:
gdf_out, gdf_in = gg.vector.remove_objects_within_buffer(buffer_object=faults.loc[782].geometry,
                                                         buffered_objects_gdf=interfaces_gdf,
                                                         distance=500,
                                                         return_gdfs=True)
Resulting GeoDataFrame containing the geometry objects that remained outside the fault buffers.
[35]:
gdf_out
[35]:
| geometry | |
|---|---|
| 0 | MULTILINESTRING ((32303580.528 5637004.216, 32... |
| 1 | MULTILINESTRING ((32305222.632 5639189.905, 32... |
| 2 | MULTILINESTRING ((32294465.330 5639887.282, 32... |
Resulting GeoDataFrame containing the geometry objects that were within the buffer. The last LineString is empty since the third layer did not touch the fault.
[36]:
gdf_in
[36]:
| geometry | |
|---|---|
| 0 | MULTILINESTRING ((32301771.153 5641329.303, 32... |
| 1 | MULTILINESTRING ((32304795.577 5636961.054, 32... |
| 2 | LINESTRING Z EMPTY |
Plotting the vertices that were kept (green) and removed (red).
[37]:
faults_gdf = gpd.GeoDataFrame(geometry=[faults.loc[782].geometry])
faults_gdf
[37]:
| geometry | |
|---|---|
| 0 | LINESTRING (32301705.663 5641428.471, 32301705... |
[38]:
fig, ax = plt.subplots(1,1)

gdf_out.plot(ax=ax, aspect='equal', color='green')
gdf_in[~gdf_in.is_empty].plot(ax=ax, aspect='equal', color='red')
faults_gdf.plot(ax=ax, aspect='equal', color='red', alpha=0.25)
gpd.GeoDataFrame(geometry=[gg.vector.create_buffer(faults.loc[782].geometry, 500)]).plot(ax=ax, aspect='equal', color='green', alpha=0.25)
plt.grid()
Performing the same operation for the entire fault buffer polyon.
[39]:
gdf_out, gdf_in = gg.vector.remove_objects_within_buffer(buffer_object=polygon,
                                                         buffered_objects_gdf=interfaces_gdf,
                                                         distance=None,
                                                         return_gdfs=True,
                                                         buffer=False)
Resulting GeoDataFrame containing the geometry objects that remained outside the fault buffers.
[40]:
gdf_out
[40]:
| geometry | |
|---|---|
| 0 | MULTILINESTRING ((32303580.528 5637004.216, 32... |
| 1 | MULTILINESTRING ((32304771.851 5638858.254, 32... |
| 2 | MULTILINESTRING ((32291916.587 5638630.583, 32... |
Resulting GeoDataFrame containing the geometry objects that were within the buffer.
[41]:
gdf_in
[41]:
| geometry | |
|---|---|
| 0 | MULTILINESTRING ((32301771.153 5641329.303, 32... |
| 1 | MULTILINESTRING ((32305222.632 5639189.905, 32... |
| 2 | MULTILINESTRING ((32294465.330 5639887.282, 32... |
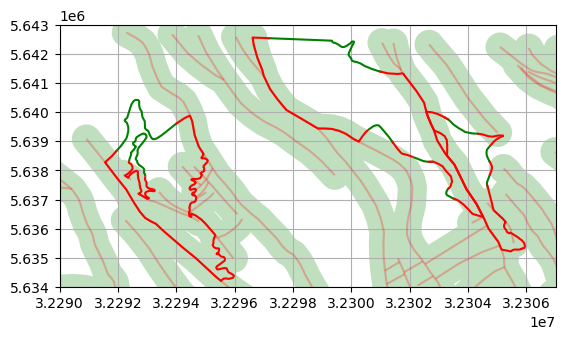
Plotting the vertices that were kept (green) and removed (red).
[42]:
fig, ax = plt.subplots(1,1)

gdf_out.plot(ax=ax, aspect='equal', color='green')
gdf_in[~gdf_in.is_empty].plot(ax=ax, aspect='equal', color='red')
faults.plot(ax=ax, aspect='equal', color='red', alpha=0.25)
gpd.GeoDataFrame(geometry=[polygon]).plot(ax=ax, aspect='equal', color='green', alpha=0.25)

plt.xlim(32290000, 32307000)
plt.ylim(5.634e6, 5.643e6)
plt.grid()
Removing all Interfaces from all Faults#
The functions above can now be generalized to the function remove_interfaces_within_fault_buffers(..) were the loaded fault GeoDataFrame and the loaded polygon GeoDataFrame are loaded.
[43]:
gdf_out, gdf_in = gg.vector.remove_interfaces_within_fault_buffers(fault_gdf=faults,
                                                                   interfaces_gdf=interfaces,
                                                                   distance=250)
The GeoDataFrame with all its column and Shapely points that remained outside a fault polygon.
[44]:
gdf_out.head()
[44]:
| OBJECTID | SYSTEM2 | SERIE2 | SSERIE2 | STUFE2 | SSTUFE2 | SYSTEM1 | SERIE1 | SSERIE1 | STUFE1 | ... | EINHEIT1 | EINHEIT2 | SSY_GSY | GE_GG | GRUTEXT | SHAPE_Leng | SHAPE_Area | geometry | X | Y | |
|---|---|---|---|---|---|---|---|---|---|---|---|---|---|---|---|---|---|---|---|---|---|
| 0 | 132 | - | - | - | - | - | Neogene | Miozän | Obermiozän | - | ... | Inden-Formation | - | mii7,s4 | 7000001110.00 | Fein- bis Mittelsand; untergeordnet Schluff un... | 4409.72 | 487296.28 | POINT (32316610.248 5635509.674) | 32316610.25 | 5635509.67 |
| 1 | 132 | - | - | - | - | - | Neogene | Miozän | Obermiozän | - | ... | Inden-Formation | - | mii7,s4 | 7000001110.00 | Fein- bis Mittelsand; untergeordnet Schluff un... | 4409.72 | 487296.28 | POINT (32316651.533 5635494.023) | 32316651.53 | 5635494.02 |
| 2 | 132 | - | - | - | - | - | Neogene | Miozän | Obermiozän | - | ... | Inden-Formation | - | mii7,s4 | 7000001110.00 | Fein- bis Mittelsand; untergeordnet Schluff un... | 4409.72 | 487296.28 | POINT (32316651.919 5635493.752) | 32316651.92 | 5635493.75 |
| 3 | 132 | - | - | - | - | - | Neogene | Miozän | Obermiozän | - | ... | Inden-Formation | - | mii7,s4 | 7000001110.00 | Fein- bis Mittelsand; untergeordnet Schluff un... | 4409.72 | 487296.28 | POINT (32316811.783 5635381.554) | 32316811.78 | 5635381.55 |
| 4 | 132 | - | - | - | - | - | Neogene | Miozän | Obermiozän | - | ... | Inden-Formation | - | mii7,s4 | 7000001110.00 | Fein- bis Mittelsand; untergeordnet Schluff un... | 4409.72 | 487296.28 | POINT (32317075.334 5635058.862) | 32317075.33 | 5635058.86 |
5 rows × 24 columns
The GeoDataFrame with all its column and Shapely points that are inside a fault polygon.
[45]:
gdf_in.head()
[45]:
| OBJECTID | SYSTEM2 | SERIE2 | SSERIE2 | STUFE2 | SSTUFE2 | SYSTEM1 | SERIE1 | SSERIE1 | STUFE1 | ... | EINHEIT1 | EINHEIT2 | SSY_GSY | GE_GG | GRUTEXT | SHAPE_Leng | SHAPE_Area | geometry | X | Y | |
|---|---|---|---|---|---|---|---|---|---|---|---|---|---|---|---|---|---|---|---|---|---|
| 0 | 131 | Devon | Oberdevon | - | Famennium | - | Devonian | Oberdevon | - | Frasnium | ... | Frasnes- und Famenne-Schiefer | - | dfrs+f,T | 45403002130.00 | Tonstein; untergeordnet Kalkmergel- bis Mergel... | 459.12 | 12043.31 | POINT (32299083.709 5631034.983) | 32299083.71 | 5631034.98 |
| 1 | 131 | Devon | Oberdevon | - | Famennium | - | Devonian | Oberdevon | - | Frasnium | ... | Frasnes- und Famenne-Schiefer | - | dfrs+f,T | 45403002130.00 | Tonstein; untergeordnet Kalkmergel- bis Mergel... | 459.12 | 12043.31 | POINT (32299164.005 5630970.066) | 32299164.01 | 5630970.07 |
| 2 | 131 | Devon | Oberdevon | - | Famennium | - | Devonian | Oberdevon | - | Frasnium | ... | Frasnes- und Famenne-Schiefer | - | dfrs+f,T | 45403002130.00 | Tonstein; untergeordnet Kalkmergel- bis Mergel... | 459.12 | 12043.31 | POINT (32299123.225 5630909.550) | 32299123.23 | 5630909.55 |
| 3 | 131 | Devon | Oberdevon | - | Famennium | - | Devonian | Oberdevon | - | Frasnium | ... | Frasnes- und Famenne-Schiefer | - | dfrs+f,T | 45403002130.00 | Tonstein; untergeordnet Kalkmergel- bis Mergel... | 459.12 | 12043.31 | POINT (32299088.346 5630931.022) | 32299088.35 | 5630931.02 |
| 4 | 131 | Devon | Oberdevon | - | Famennium | - | Devonian | Oberdevon | - | Frasnium | ... | Frasnes- und Famenne-Schiefer | - | dfrs+f,T | 45403002130.00 | Tonstein; untergeordnet Kalkmergel- bis Mergel... | 459.12 | 12043.31 | POINT (32298996.618 5630993.458) | 32298996.62 | 5630993.46 |
5 rows × 24 columns
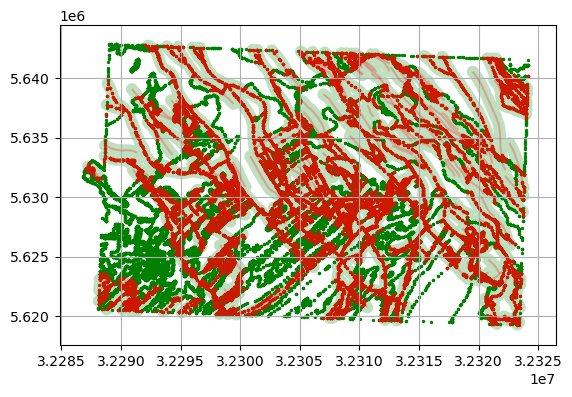
Plotting the final result of interfaces that are outside a fault polygon (green) and interfaces inside a fault polygon (red).
[46]:
fig, ax = plt.subplots(1,1)

gdf_out.plot(ax=ax, aspect='equal', color='green',markersize=2)
gdf_in[~gdf_in.is_empty].plot(ax=ax, aspect='equal', color='red', markersize=2)
faults.plot(ax=ax, aspect='equal', color='red', alpha=0.25)
gpd.GeoDataFrame(geometry=[polygon]).plot(ax=ax, aspect='equal', color='green', alpha=0.25)

plt.grid()