44 Fitting a plane through earthquake hypocenters
Contents
44 Fitting a plane through earthquake hypocenters#
A plane can be put through a set of hypocenters of earthquakes to see if they would coincide with a single fault plane.
Set File Paths and download Tutorial Data#
If you downloaded the latest GemGIS version from the Github repository, append the path so that the package can be imported successfully. Otherwise, it is recommended to install GemGIS via pip install gemgis and import GemGIS using import gemgis as gg. In addition, the file path to the folder where the data is being stored is set. The tutorial data is downloaded using Pooch (https://www.fatiando.org/pooch/latest/index.html) and stored in the specified folder. Use
pip install pooch if Pooch is not installed on your system yet.
[1]:
import gemgis as gg

file_path ='data/44_fitting_plane_through_earthquake_hypocenters/'
WARNING (theano.configdefaults): g++ not available, if using conda: `conda install m2w64-toolchain`
C:\Users\ale93371\Anaconda3\envs\test_gempy\lib\site-packages\theano\configdefaults.py:560: UserWarning: DeprecationWarning: there is no c++ compiler.This is deprecated and with Theano 0.11 a c++ compiler will be mandatory
  warnings.warn("DeprecationWarning: there is no c++ compiler."
WARNING (theano.configdefaults): g++ not detected ! Theano will be unable to execute optimized C-implementations (for both CPU and GPU) and will default to Python implementations. Performance will be severely degraded. To remove this warning, set Theano flags cxx to an empty string.
WARNING (theano.tensor.blas): Using NumPy C-API based implementation for BLAS functions.
[2]:
gg.download_gemgis_data.download_tutorial_data(filename="44_fitting_plane_through_earthquake_hypocenters.zip", dirpath=file_path)
Downloading file '44_fitting_plane_through_earthquake_hypocenters.zip' from 'https://rwth-aachen.sciebo.de/s/AfXRsZywYDbUF34/download?path=%2F44_fitting_plane_through_earthquake_hypocenters.zip' to 'C:\Users\ale93371\Documents\gemgis\docs\getting_started\tutorial\data\44_fitting_plane_through_earthquake_hypocenters'.
Loading Earthquake Data#
The data from earthquakes in the beginning of January 2021 is used.
[2]:
import geopandas as gpd

gdf = gpd.read_file(filename= file_path+'earthquake_data.shp')
gdf['Z'] = gdf['Tiefe [km]']*(-1000)
gdf
WARNING (theano.configdefaults): g++ not available, if using conda: `conda install m2w64-toolchain`
C:\Users\ale93371\Anaconda3\envs\test_gempy\lib\site-packages\theano\configdefaults.py:560: UserWarning: DeprecationWarning: there is no c++ compiler.This is deprecated and with Theano 0.11 a c++ compiler will be mandatory
  warnings.warn("DeprecationWarning: there is no c++ compiler."
WARNING (theano.configdefaults): g++ not detected ! Theano will be unable to execute optimized C-implementations (for both CPU and GPU) and will default to Python implementations. Performance will be severely degraded. To remove this warning, set Theano flags cxx to an empty string.
WARNING (theano.tensor.blas): Using NumPy C-API based implementation for BLAS functions.
[2]:
| Datum | Uhrzeit (U | Breite [° | Länge [° | Tiefe [km] | Magnitude | Epizentrum | geometry | Z | |
|---|---|---|---|---|---|---|---|---|---|
| 0 | 08.01.2021 | 02:56:50.400 | 50.69 | 6.23 | 10.00 | 1.60 | S MULARTSHUETTE | POINT (32304265.590 5618571.115) | -10000.00 |
| 1 | 06.01.2021 | 23:59:43.400 | 50.70 | 6.22 | 9.00 | 0.10 | MULARTSHUETTE | POINT (32303759.041 5620148.713) | -9000.00 |
| 2 | 06.01.2021 | 18:43:18.900 | 50.69 | 6.23 | 8.80 | 1.60 | S MULARTSHUETTE | POINT (32304643.654 5619224.937) | -8800.00 |
| 3 | 06.01.2021 | 12:03:38.100 | 50.70 | 6.22 | 9.20 | 0.10 | MULARTSHUETTE | POINT (32303817.122 5619812.545) | -9200.00 |
| 4 | 06.01.2021 | 11:18:11.500 | 50.69 | 6.22 | 9.10 | 0.80 | MULARTSHUETTE | POINT (32303871.041 5619365.205) | -9100.00 |
| 5 | 06.01.2021 | 04:14:19.000 | 50.69 | 6.24 | 11.30 | 1.10 | S MULARTSHUETTE | POINT (32304851.354 5619105.849) | -11300.00 |
| 6 | 05.01.2021 | 04:26:56.800 | 50.70 | 6.24 | 9.70 | 0.70 | S MULARTSHUETTE | POINT (32304730.889 5619666.987) | -9700.00 |
| 7 | 04.01.2021 | 05:57:23.900 | 50.69 | 6.23 | 10.00 | 0.50 | S MULARTSHUETTE | POINT (32304348.701 5618901.987) | -10000.00 |
| 8 | 03.01.2021 | 20:49:33.700 | 50.70 | 6.24 | 10.50 | 0.20 | MULARTSHUETTE | POINT (32304730.889 5619666.987) | -10500.00 |
| 9 | 03.01.2021 | 15:01:48.500 | 50.70 | 6.22 | 7.90 | 0.30 | MULARTSHUETTE | POINT (32303547.227 5620156.674) | -7900.00 |
| 10 | 03.01.2021 | 06:25:50.100 | 50.70 | 6.23 | 10.00 | 0.20 | MULARTSHUETTE | POINT (32304170.169 5619799.301) | -10000.00 |
| 11 | 03.01.2021 | 06:04:51.700 | 50.69 | 6.23 | 10.20 | 0.80 | S MULARTSHUETTE | POINT (32304419.322 5618899.344) | -10200.00 |
| 12 | 03.01.2021 | 05:41:54.100 | 50.69 | 6.23 | 10.00 | 0.80 | S MULARTSHUETTE | POINT (32304082.887 5619357.259) | -10000.00 |
| 13 | 03.01.2021 | 03:03:59.000 | 50.69 | 6.23 | 10.30 | 0.10 | S MULARTSHUETTE | POINT (32304286.406 5619126.976) | -10300.00 |
| 14 | 03.01.2021 | 02:41:14.200 | 50.69 | 6.23 | 10.30 | 0.80 | S MULARTSHUETTE | POINT (32304631.187 5618891.420) | -10300.00 |
| 15 | 03.01.2021 | 00:47:14.600 | 50.69 | 6.23 | 10.00 | 0.30 | S MULARTSHUETTE | POINT (32304647.810 5619336.109) | -10000.00 |
| 16 | 03.01.2021 | 00:13:27.800 | 50.70 | 6.24 | 10.80 | 0.20 | E MULARTSHUETTE | POINT (32305250.032 5620315.575) | -10800.00 |
| 17 | 02.01.2021 | 14:57:37.700 | 50.69 | 6.23 | 10.60 | 0.80 | S MULARTSHUETTE | POINT (32304485.785 5618785.530) | -10600.00 |
| 18 | 02.01.2021 | 14:46:34.300 | 50.69 | 6.21 | 8.20 | 0.20 | MULARTSHUETTE | POINT (32302878.235 5619291.232) | -8200.00 |
| 19 | 02.01.2021 | 14:33:58.500 | 50.69 | 6.24 | 11.40 | 0.70 | S MULARTSHUETTE | POINT (32304921.972 5619103.213) | -11400.00 |
| 20 | 02.01.2021 | 14:05:37.600 | 50.70 | 6.21 | 8.60 | 0.40 | MULARTSHUETTE | POINT (32303318.673 5619719.955) | -8600.00 |
| 21 | 02.01.2021 | 13:39:30.500 | 50.69 | 6.21 | 8.90 | 0.50 | S MULARTSHUETTE | POINT (32303152.326 5619058.241) | -8900.00 |
| 22 | 02.01.2021 | 10:19:41.400 | 50.70 | 6.22 | 9.70 | 0.50 | MULARTSHUETTE | POINT (32303808.774 5619590.201) | -9700.00 |
| 23 | 02.01.2021 | 07:31:02.200 | 50.69 | 6.21 | 9.20 | 0.50 | MULARTSHUETTE | POINT (32303077.518 5618949.729) | -9200.00 |
| 24 | 02.01.2021 | 06:36:29.300 | 50.69 | 6.22 | 10.50 | 2.70 | S MULARTSHUETTE | POINT (32303700.583 5618592.303) | -10500.00 |
| 25 | 01.01.2021 | 20:34:53.800 | 50.69 | 6.23 | 9.80 | 0.10 | S MULARTSHUETTE | POINT (32304286.406 5619126.976) | -9800.00 |
| 26 | 01.01.2021 | 14:26:51.000 | 50.69 | 6.22 | 9.90 | 1.00 | S MULARTSHUETTE | POINT (32303841.835 5618587.001) | -9900.00 |
| 27 | 01.01.2021 | 14:26:12.400 | 50.69 | 6.23 | 10.70 | 0.10 | S MULARTSHUETTE | POINT (32304207.458 5618907.277) | -10700.00 |
| 28 | 01.01.2021 | 14:20:20.500 | 50.69 | 6.22 | 9.60 | 0.10 | S MULARTSHUETTE | POINT (32303779.556 5618811.996) | -9600.00 |
Create Meshes#
[3]:
spheres = gg.visualization.create_meshes_hypocenters(gdf=gdf)
spheres.save(file_path + 'spheres.vtm')
spheres
[3]:
| Information | Blocks | ||||||||||||||||||||||||||||||||||||||||||||||||||||||||||||||||||||||||||||||||||||||||||||||||||||
|---|---|---|---|---|---|---|---|---|---|---|---|---|---|---|---|---|---|---|---|---|---|---|---|---|---|---|---|---|---|---|---|---|---|---|---|---|---|---|---|---|---|---|---|---|---|---|---|---|---|---|---|---|---|---|---|---|---|---|---|---|---|---|---|---|---|---|---|---|---|---|---|---|---|---|---|---|---|---|---|---|---|---|---|---|---|---|---|---|---|---|---|---|---|---|---|---|---|---|---|---|---|
|
|
[4]:
type(spheres)
[4]:
pyvista.core.composite.MultiBlock
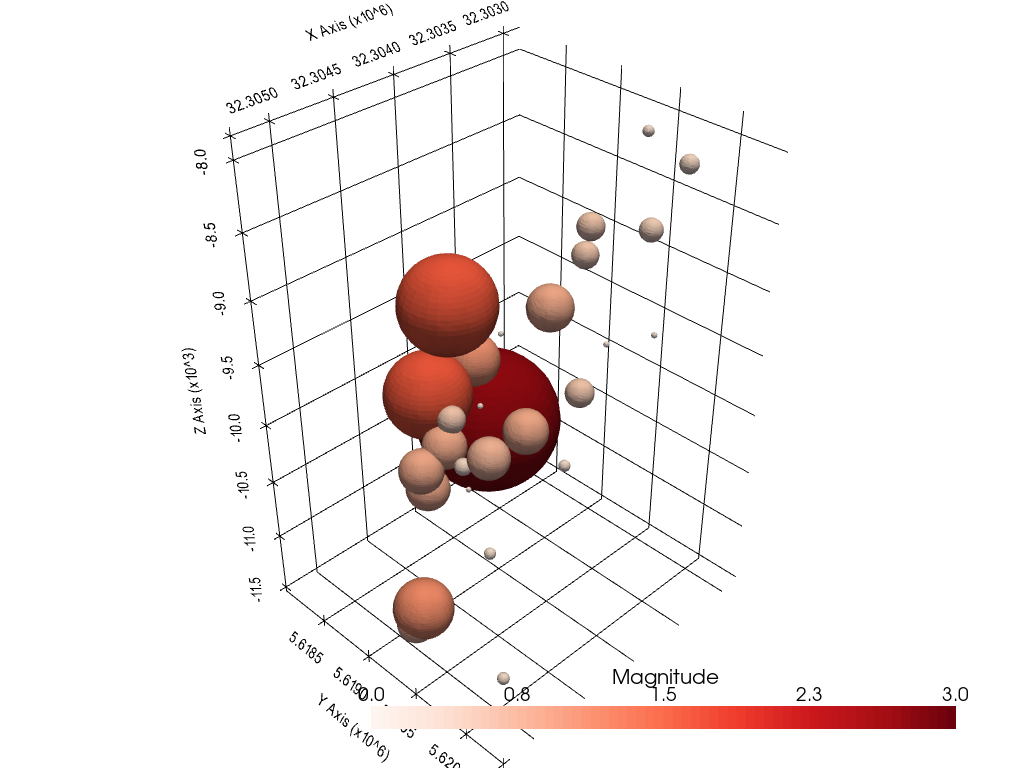
Plot Data#
[5]:
import pyvista as pv

sargs = dict(fmt="%.1f", color='black')

p = pv.Plotter(notebook=True)

p.add_mesh(spheres,scalars='Magnitude', cmap='Reds', clim=[0,3], scalar_bar_args=sargs)

p.set_background('white')
p.show_grid(color='black')
p.show()
[6]:
centers = [spheres.GetBlock(block).center for block in range(spheres.GetNumberOfBlocks())]
centers[:10]
[6]:
[[32304266.0, 5618571.25, -10000.0],
 [32303760.0, 5620148.75, -9000.0],
 [32304644.0, 5619224.75, -8800.0],
 [32303818.0, 5619812.5, -9200.0],
 [32303871.0, 5619365.25, -9100.0],
 [32304852.0, 5619106.0, -11300.0],
 [32304731.0, 5619667.0, -9700.0],
 [32304348.0, 5618902.0, -10000.0],
 [32304730.0, 5619667.0, -10500.0],
 [32303548.0, 5620156.75, -7900.0]]
[7]:
import numpy as np

array = np.array(centers)
array[:10]
[7]:
array([[ 3.23042660e+07,  5.61857125e+06, -1.00000000e+04],
       [ 3.23037600e+07,  5.62014875e+06, -9.00000000e+03],
       [ 3.23046440e+07,  5.61922475e+06, -8.80000000e+03],
       [ 3.23038180e+07,  5.61981250e+06, -9.20000000e+03],
       [ 3.23038710e+07,  5.61936525e+06, -9.10000000e+03],
       [ 3.23048520e+07,  5.61910600e+06, -1.13000000e+04],
       [ 3.23047310e+07,  5.61966700e+06, -9.70000000e+03],
       [ 3.23043480e+07,  5.61890200e+06, -1.00000000e+04],
       [ 3.23047300e+07,  5.61966700e+06, -1.05000000e+04],
       [ 3.23035480e+07,  5.62015675e+06, -7.90000000e+03]])
[8]:
C = np.cov(array, rowvar=False)
eig, eiv = np.linalg.eigh(C)
normal = eiv[:, 0]
normal
[8]:
array([-0.70904181, 0.49482888, -0.50239834])
[9]:
center = [array[:, 0].mean(),array[:, 1].mean(),array[:, 2].mean()]
center
[9]:
[32304121.20689655, 5619271.405172414, -9800.0]
[10]:
plane = pv.Plane(center=center, direction=normal, i_size=5000, j_size=5000)
plane
[10]:
| Header | Data Arrays | ||||||||||||||||||||||||||||||||
|---|---|---|---|---|---|---|---|---|---|---|---|---|---|---|---|---|---|---|---|---|---|---|---|---|---|---|---|---|---|---|---|---|---|
|
|
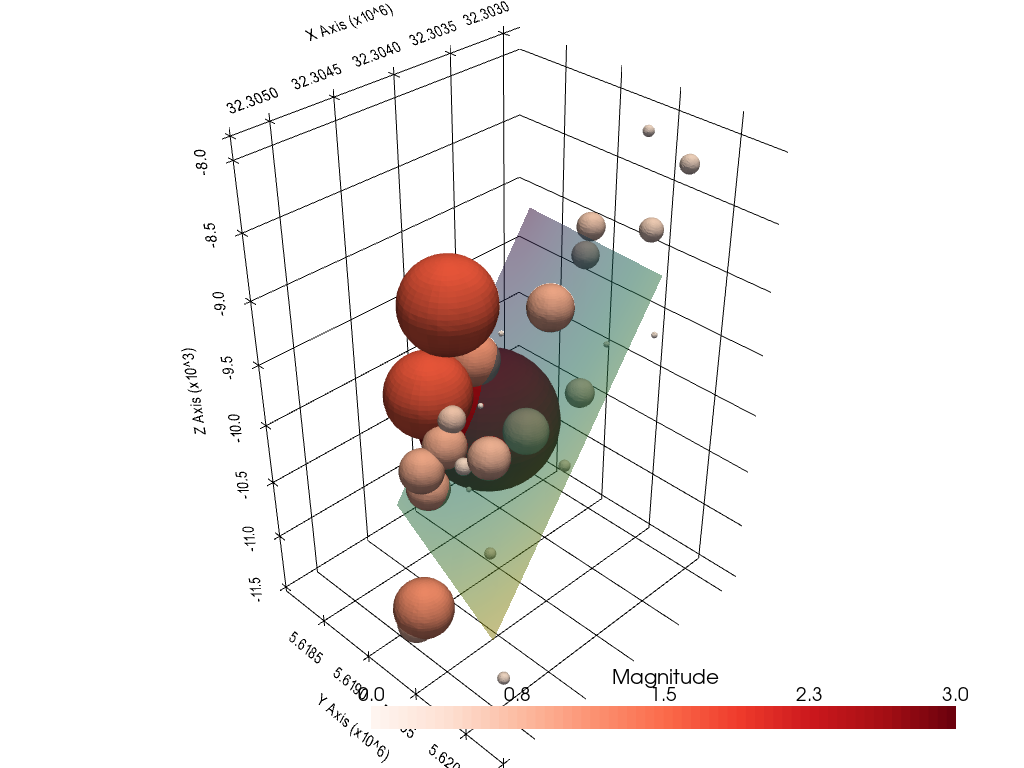
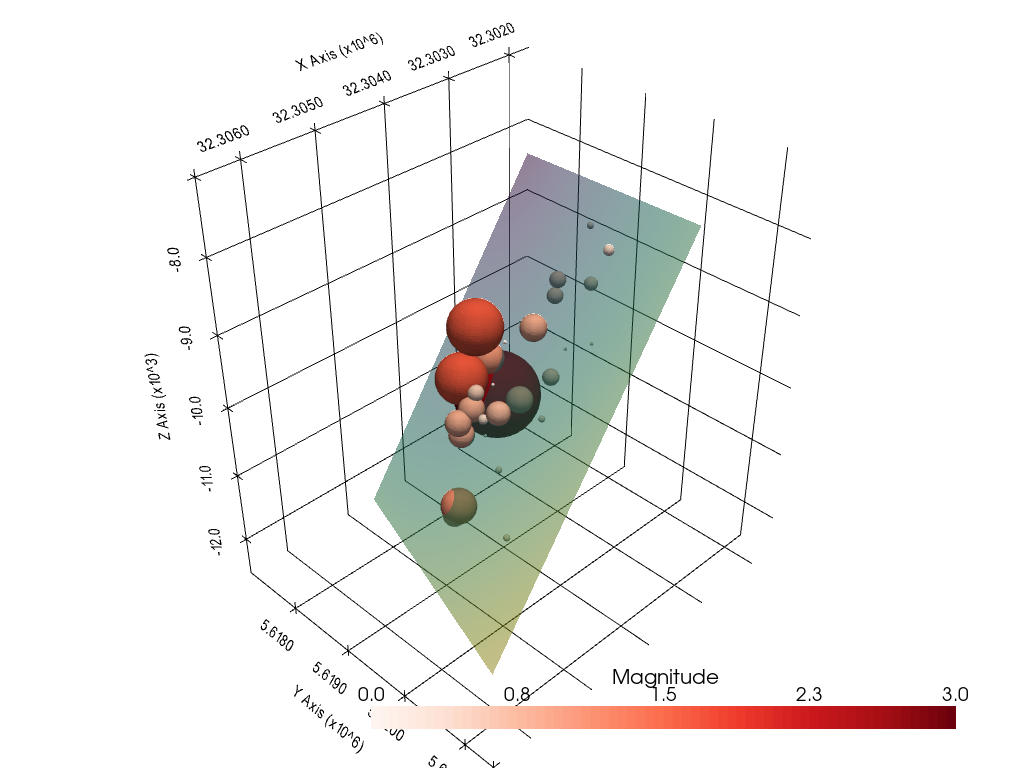
[11]:
import pyvista as pv

sargs = dict(fmt="%.1f", color='black')

p = pv.Plotter(notebook=True)

p.add_mesh(spheres,scalars='Magnitude', cmap='Reds', clim=[0,3], scalar_bar_args=sargs)
p.add_mesh(plane, opacity=0.5, show_scalar_bar=False)

p.set_background('white')
p.show_grid(color='black')
p.show()
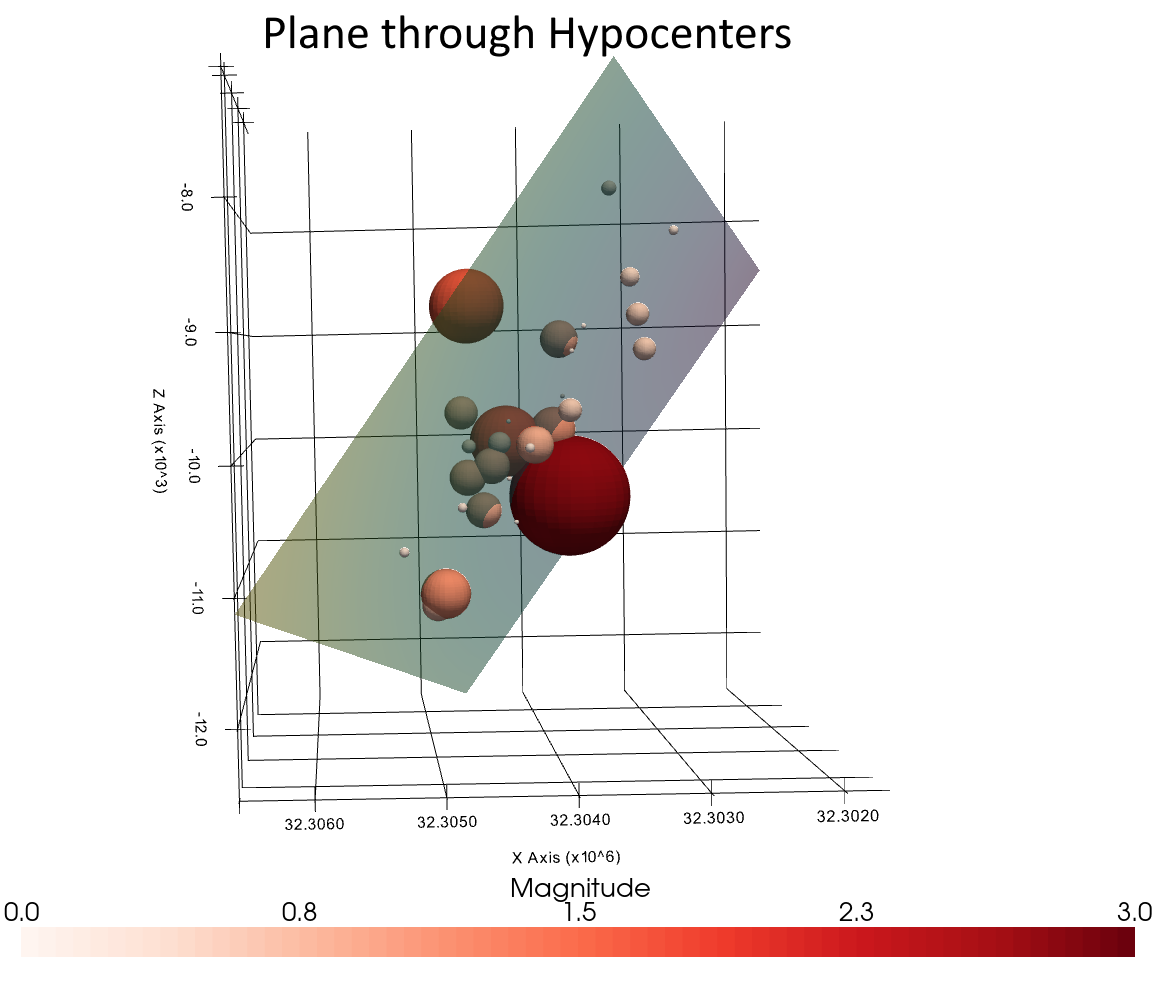
The functionality shown above is also implemented in the function plane_through_hypocenters(..).
[12]:
plane = gg.visualization.plane_through_hypocenters(spheres=spheres)
plane
[12]:
| Header | Data Arrays | ||||||||||||||||||||||||||||||||
|---|---|---|---|---|---|---|---|---|---|---|---|---|---|---|---|---|---|---|---|---|---|---|---|---|---|---|---|---|---|---|---|---|---|
|
|
[13]:
import pyvista as pv

sargs = dict(fmt="%.1f", color='black')

p = pv.Plotter(notebook=True)

p.add_mesh(spheres,scalars='Magnitude', cmap='Reds', clim=[0,3], scalar_bar_args=sargs)
p.add_mesh(plane, opacity=0.5, show_scalar_bar=False)

p.set_background('white')
p.show_grid(color='black')
p.show()