08 Sampling Interfaces and Orientations from Raster
Contents
08 Sampling Interfaces and Orientations from Raster#
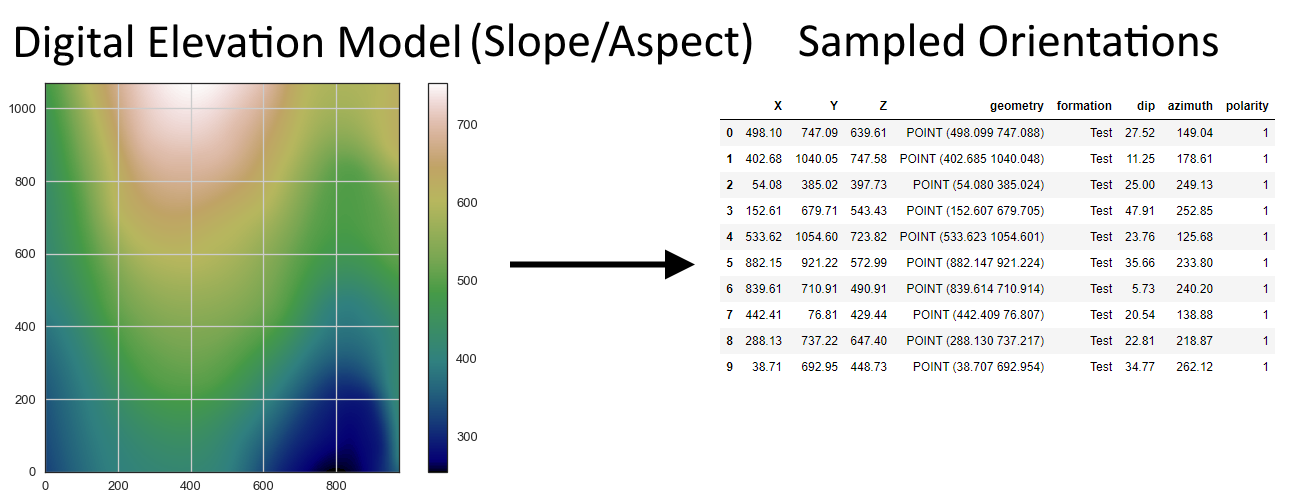
Interfaces can be directly sampled from a digital elevation model or subsurface raster/mesh while orientations have to be sampled from the digital elevation model/raster, the slope for the dipping angle and the aspect for the azimuth.
Set File Paths and download Tutorial Data#
If you downloaded the latest GemGIS version from the Github repository, append the path so that the package can be imported successfully. Otherwise, it is recommended to install GemGIS via pip install gemgis and import GemGIS using import gemgis as gg. In addition, the file path to the folder where the data is being stored is set. The tutorial data is downloaded using Pooch (https://www.fatiando.org/pooch/latest/index.html) and stored in the specified folder. Use
pip install pooch if Pooch is not installed on your system yet.
[1]:
import gemgis as gg

file_path ='data/08_sampling_interfaces_orientations_from_raster/'
[2]:
gg.download_gemgis_data.download_tutorial_data(filename="08_sampling_interfaces_orientations_from_raster.zip", dirpath=file_path)
Downloading file '08_sampling_interfaces_orientations_from_raster.zip' from 'https://rwth-aachen.sciebo.de/s/AfXRsZywYDbUF34/download?path=%2F08_sampling_interfaces_orientations_from_raster.zip' to 'C:\Users\ale93371\Documents\gemgis\docs\getting_started\tutorial\data\08_sampling_interfaces_orientations_from_raster'.
Loading raster data#
[3]:
import rasterio

raster = rasterio.open(file_path + 'raster.tif')
[4]:
raster.bounds
[4]:
BoundingBox(left=-4.440892098500626e-16, bottom=1.3642420526593924e-12, right=971.002897605575, top=1068.1031873661339)
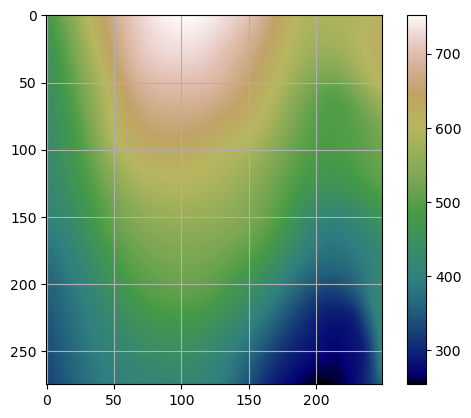
Plotting the raster#
[5]:
import matplotlib.pyplot as plt

im = plt.imshow(raster.read(1), cmap='gist_earth')
plt.grid()
plt.colorbar(im)
[5]:
<matplotlib.colorbar.Colorbar at 0x2aaf1e504c0>
Sampling Interfaces from Raster#
Sampling by lists#
Sampling interfaces from a raster given lists of X and Y coordinates is done using sample_interfaces(..).
[6]:
point_x = [100, 200, 300, 400, 500]
point_y = [100, 200, 300, 400, 500]

gdf = gg.raster.sample_interfaces(raster=raster,
                                  point_x=point_x,
                                  point_y=point_y,
                                  formation='Test',
                                  crs='EPSG:4326')

gdf
[6]:
| X | Y | Z | geometry | formation | |
|---|---|---|---|---|---|
| 0 | 100.00 | 100.00 | 376.72 | POINT (100.00000 100.00000) | Test |
| 1 | 200.00 | 200.00 | 435.22 | POINT (200.00000 200.00000) | Test |
| 2 | 300.00 | 300.00 | 505.29 | POINT (300.00000 300.00000) | Test |
| 3 | 400.00 | 400.00 | 540.68 | POINT (400.00000 400.00000) | Test |
| 4 | 500.00 | 500.00 | 561.65 | POINT (500.00000 500.00000) | Test |
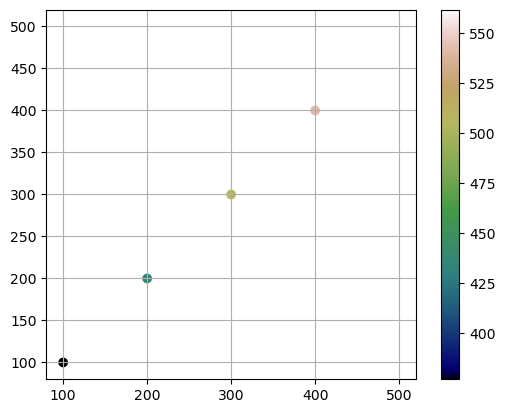
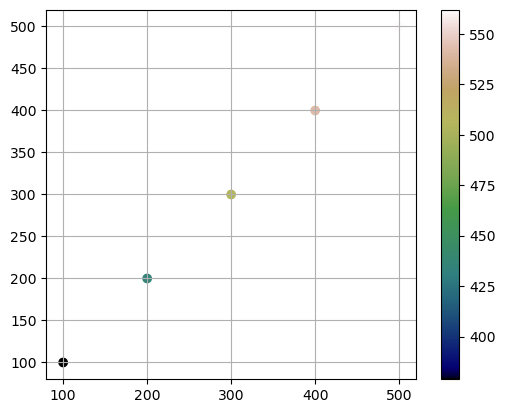
Plotting the data#
[7]:
gdf.plot(column='Z', cmap='gist_earth', aspect='equal', legend=True)
plt.grid()
Sampling by arrays#
Sampling interfaces from an array given lists of X and Y coordinates.
[8]:
point_x = [100, 200, 300, 400 ,500]
point_y = [100, 200, 300, 400 ,500]

gdf = gg.raster.sample_interfaces(raster=raster.read(1),
                                  point_x=point_x,
                                  point_y=point_y,
                                  extent=[0, 972, 0 ,1069],
                                  formation='Test',
                                  crs='EPSG:4326')

gdf
[8]:
| X | Y | Z | geometry | formation | |
|---|---|---|---|---|---|
| 0 | 100.00 | 100.00 | 378.80 | POINT (100.00000 100.00000) | Test |
| 1 | 200.00 | 200.00 | 435.22 | POINT (200.00000 200.00000) | Test |
| 2 | 300.00 | 300.00 | 505.29 | POINT (300.00000 300.00000) | Test |
| 3 | 400.00 | 400.00 | 541.74 | POINT (400.00000 400.00000) | Test |
| 4 | 500.00 | 500.00 | 562.02 | POINT (500.00000 500.00000) | Test |
Plotting the data#
[9]:
gdf.plot(column='Z', cmap='gist_earth', aspect='equal', legend=True)
plt.grid()
Sampling Randomly from rasterio object#
Sampling interfaces randomly from a raster.
[10]:
gdf = gg.raster.sample_interfaces(raster=raster,
                                  random_samples=10,
                                  formation='Test',
                                  crs='EPSG:4326')

gdf
[10]:
| X | Y | Z | geometry | formation | |
|---|---|---|---|---|---|
| 0 | 199.86 | 496.09 | 520.81 | POINT (199.85519 496.09330) | Test |
| 1 | 511.85 | 763.18 | 643.24 | POINT (511.85172 763.17686) | Test |
| 2 | 643.35 | 886.38 | 620.91 | POINT (643.35122 886.37867) | Test |
| 3 | 965.65 | 1045.58 | 620.59 | POINT (965.65475 1045.58279) | Test |
| 4 | 172.10 | 864.05 | 602.61 | POINT (172.10151 864.05005) | Test |
| 5 | 744.41 | 52.90 | 276.00 | POINT (744.40762 52.90476) | Test |
| 6 | 739.94 | 823.36 | 533.44 | POINT (739.93577 823.35867) | Test |
| 7 | 942.70 | 406.58 | 414.82 | POINT (942.69846 406.58069) | Test |
| 8 | 420.50 | 87.25 | 436.52 | POINT (420.50070 87.24755) | Test |
| 9 | 339.68 | 264.21 | 503.23 | POINT (339.68451 264.21229) | Test |
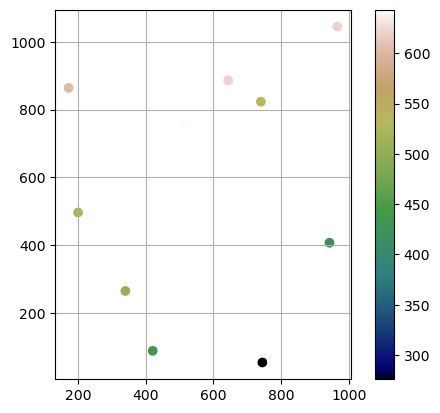
Plotting the data#
[11]:
gdf.plot(column='Z', cmap='gist_earth', aspect='equal', legend=True)
plt.grid()
Sampling Randomly from Array#
Sampling interfaces randomly from an array.
[12]:
gdf = gg.raster.sample_interfaces(raster=raster.read(1),
                                  random_samples=10,
                                  extent=[0, 972, 0 ,1069],
                                  formation='Test',
                                  crs='EPSG:4326')

gdf
[12]:
| X | Y | Z | geometry | formation | |
|---|---|---|---|---|---|
| 0 | 950.27 | 424.37 | 426.03 | POINT (950.26670 424.37299) | Test |
| 1 | 205.91 | 83.67 | 410.35 | POINT (205.90842 83.67224) | Test |
| 2 | 833.19 | 424.42 | 388.64 | POINT (833.18890 424.42058) | Test |
| 3 | 442.79 | 68.90 | 427.47 | POINT (442.79487 68.90223) | Test |
| 4 | 333.34 | 642.61 | 620.60 | POINT (333.33986 642.60911) | Test |
| 5 | 905.91 | 585.65 | 484.48 | POINT (905.90705 585.64586) | Test |
| 6 | 359.39 | 1025.74 | 742.35 | POINT (359.39233 1025.74463) | Test |
| 7 | 599.42 | 936.93 | 660.12 | POINT (599.41731 936.92645) | Test |
| 8 | 14.28 | 532.99 | 417.31 | POINT (14.28131 532.98620) | Test |
| 9 | 177.50 | 985.25 | 643.90 | POINT (177.49500 985.24662) | Test |
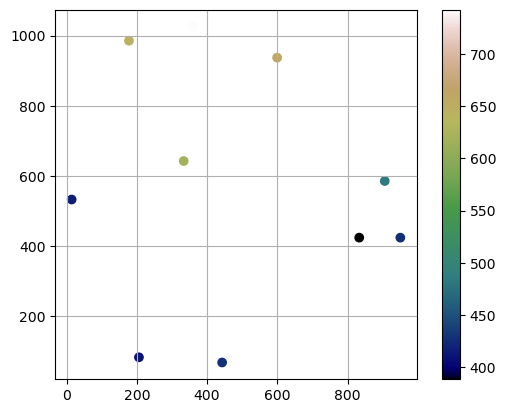
Plotting the data#
[13]:
gdf.plot(column='Z', cmap='gist_earth', aspect='equal', legend=True)
plt.grid()
Sampling Orientations from Raster#
Sampling from lists#
Sampling orientations from a raster given lists of X and Y coordinates.
[14]:
point_x = [100, 200, 300, 400 ,500]
point_y = [100, 200, 300, 400 ,500]

gdf = gg.raster.sample_orientations(raster=raster,
                                    point_x=point_x,
                                    point_y=point_y,
                                    formation='Test',
                                    crs='EPSG:4326')

gdf
[14]:
| X | Y | Z | geometry | formation | dip | azimuth | polarity | |
|---|---|---|---|---|---|---|---|---|
| 0 | 100.00 | 100.00 | 376.72 | POINT (100.00000 100.00000) | Test | 23.77 | 255.93 | 1 |
| 1 | 200.00 | 200.00 | 435.22 | POINT (200.00000 200.00000) | Test | 30.46 | 239.55 | 1 |
| 2 | 300.00 | 300.00 | 505.29 | POINT (300.00000 300.00000) | Test | 17.34 | 222.68 | 1 |
| 3 | 400.00 | 400.00 | 540.68 | POINT (400.00000 400.00000) | Test | 15.51 | 178.84 | 1 |
| 4 | 500.00 | 500.00 | 561.65 | POINT (500.00000 500.00000) | Test | 19.26 | 145.55 | 1 |
Plotting the data#
[15]:
gdf.plot(column='Z', cmap='gist_earth', aspect='equal', legend=True)
plt.grid()

Sampling from arrays#
Sampling orientations from an array given lists of X and Y coordinates.
[16]:
point_x = [100, 200, 300, 400 ,500]
point_y = [100, 200, 300, 400 ,500]

gdf = gg.raster.sample_orientations(raster=raster.read(1),
                                    point_x=point_x,
                                    point_y=point_y,
                                    extent=[0, 972, 0 ,1069],
                                    formation='Test',
                                    crs='EPSG:4326')

gdf
[16]:
| X | Y | Z | geometry | formation | dip | azimuth | polarity | |
|---|---|---|---|---|---|---|---|---|
| 0 | 100.00 | 100.00 | 378.80 | POINT (100.00000 100.00000) | Test | 23.75 | 255.93 | 1 |
| 1 | 200.00 | 200.00 | 435.22 | POINT (200.00000 200.00000) | Test | 30.44 | 239.55 | 1 |
| 2 | 300.00 | 300.00 | 505.29 | POINT (300.00000 300.00000) | Test | 17.32 | 222.68 | 1 |
| 3 | 400.00 | 400.00 | 541.74 | POINT (400.00000 400.00000) | Test | 15.50 | 178.84 | 1 |
| 4 | 500.00 | 500.00 | 562.02 | POINT (500.00000 500.00000) | Test | 19.24 | 145.55 | 1 |
Sampling randomly from rasterio object#
Sampling orientations randomly from a raster.
[17]:
gdf = gg.raster.sample_orientations(raster=raster,
                                    random_samples=10,
                                    formation='Test',
                                    crs='EPSG:4326')

gdf
[17]:
| X | Y | Z | geometry | formation | dip | azimuth | polarity | |
|---|---|---|---|---|---|---|---|---|
| 0 | 770.72 | 454.44 | 411.17 | POINT (770.72317 454.43623) | Test | 35.50 | 126.05 | 1 |
| 1 | 98.85 | 104.73 | 377.13 | POINT (98.85090 104.72719) | Test | 24.00 | 256.35 | 1 |
| 2 | 439.88 | 23.92 | 417.44 | POINT (439.88303 23.91500) | Test | 15.43 | 138.91 | 1 |
| 3 | 444.39 | 434.85 | 548.88 | POINT (444.39082 434.84986) | Test | 16.92 | 165.67 | 1 |
| 4 | 642.46 | 857.77 | 612.54 | POINT (642.45819 857.77092) | Test | 33.90 | 115.23 | 1 |
| 5 | 668.68 | 101.45 | 321.65 | POINT (668.68137 101.45438) | Test | 34.24 | 122.96 | 1 |
| 6 | 833.16 | 737.23 | 491.34 | POINT (833.16382 737.23242) | Test | 3.94 | 242.61 | 1 |
| 7 | 137.75 | 604.27 | 506.55 | POINT (137.75113 604.27271) | Test | 39.04 | 252.36 | 1 |
| 8 | 249.23 | 610.05 | 590.12 | POINT (249.22976 610.04522) | Test | 30.48 | 224.83 | 1 |
| 9 | 799.49 | 1011.20 | 581.62 | POINT (799.49348 1011.19910) | Test | 11.49 | 170.42 | 1 |
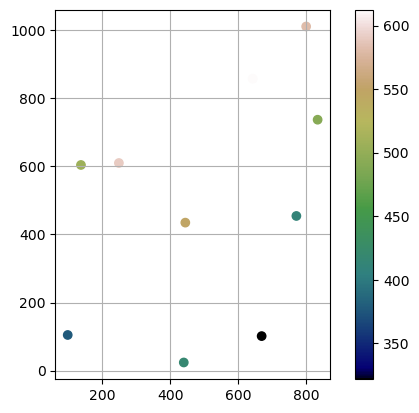
Plotting the data#
[18]:
gdf.plot(column='Z', cmap='gist_earth', aspect='equal', legend=True)
plt.grid()
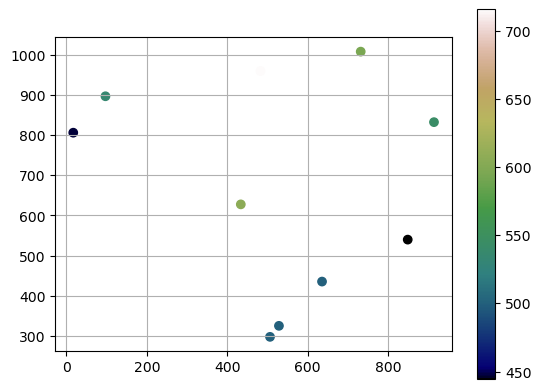
Sample randomly from array#
Sampling orientations randomly from an array.
[19]:
gdf = gg.raster.sample_orientations(raster=raster.read(1),
                                    random_samples=10,
                                    extent=[0, 972, 0 ,1069],
                                    formation='Test',
                                    crs='EPSG:4326')

gdf
[19]:
| X | Y | Z | geometry | formation | dip | azimuth | polarity | |
|---|---|---|---|---|---|---|---|---|
| 0 | 433.83 | 627.61 | 606.19 | POINT (433.82765 627.60890) | Test | 19.29 | 144.83 | 1 |
| 1 | 732.25 | 1007.74 | 594.51 | POINT (732.25432 1007.73581) | Test | 21.30 | 109.13 | 1 |
| 2 | 849.26 | 539.88 | 444.47 | POINT (849.25852 539.87992) | Test | 29.99 | 196.23 | 1 |
| 3 | 506.54 | 297.89 | 499.94 | POINT (506.54294 297.89069) | Test | 22.06 | 134.76 | 1 |
| 4 | 482.80 | 959.46 | 715.72 | POINT (482.79546 959.45977) | Test | 21.73 | 129.97 | 1 |
| 5 | 914.62 | 832.23 | 543.36 | POINT (914.61626 832.23124) | Test | 45.25 | 231.65 | 1 |
| 6 | 16.88 | 805.99 | 447.03 | POINT (16.88303 805.98712) | Test | 37.63 | 260.69 | 1 |
| 7 | 97.01 | 896.66 | 534.58 | POINT (97.00884 896.65803) | Test | 48.06 | 257.25 | 1 |
| 8 | 528.77 | 325.33 | 500.61 | POINT (528.77290 325.33217) | Test | 20.33 | 138.42 | 1 |
| 9 | 635.98 | 435.47 | 500.45 | POINT (635.98363 435.47230) | Test | 29.20 | 118.66 | 1 |
Plotting the data#
[20]:
gdf.plot(column='Z', cmap='gist_earth', aspect='equal', legend=True)
plt.grid()